Dominican vs Iroquois Seniors Poverty Over the Age of 75
COMPARE
Dominican
Iroquois
Seniors Poverty Over the Age of 75
Seniors Poverty Over the Age of 75 Comparison
Dominicans
Iroquois
19.6%
SENIORS POVERTY OVER THE AGE OF 75
0.0/ 100
METRIC RATING
342nd/ 347
METRIC RANK
14.0%
SENIORS POVERTY OVER THE AGE OF 75
0.1/ 100
METRIC RATING
263rd/ 347
METRIC RANK
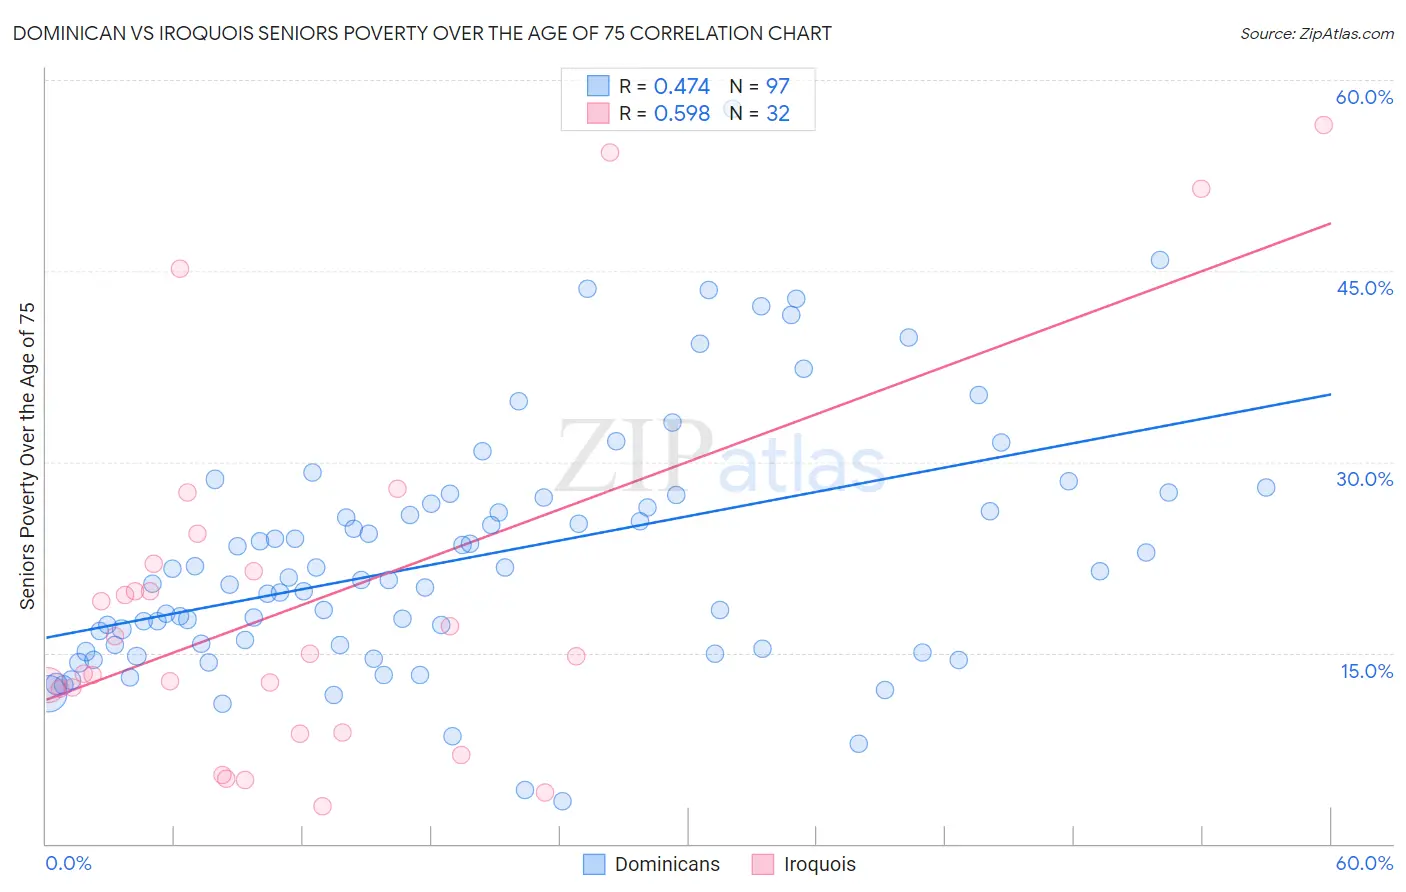
Dominican vs Iroquois Seniors Poverty Over the Age of 75 Correlation Chart
The statistical analysis conducted on geographies consisting of 350,851,052 people shows a moderate positive correlation between the proportion of Dominicans and poverty level among seniors over the age of 75 in the United States with a correlation coefficient (R) of 0.474 and weighted average of 19.6%. Similarly, the statistical analysis conducted on geographies consisting of 205,964,404 people shows a substantial positive correlation between the proportion of Iroquois and poverty level among seniors over the age of 75 in the United States with a correlation coefficient (R) of 0.598 and weighted average of 14.0%, a difference of 40.0%.
Seniors Poverty Over the Age of 75 Correlation Summary
| Measurement | Dominican | Iroquois |
| Minimum | 3.4% | 2.9% |
| Maximum | 57.7% | 56.5% |
| Range | 54.4% | 53.5% |
| Mean | 22.5% | 19.0% |
| Median | 20.8% | 14.9% |
| Interquartile 25% (IQ1) | 15.5% | 10.4% |
| Interquartile 75% (IQ3) | 27.0% | 21.7% |
| Interquartile Range (IQR) | 11.5% | 11.3% |
| Standard Deviation (Sample) | 9.7% | 14.3% |
| Standard Deviation (Population) | 9.6% | 14.1% |
Similar Demographics by Seniors Poverty Over the Age of 75
Demographics Similar to Dominicans by Seniors Poverty Over the Age of 75
In terms of seniors poverty over the age of 75, the demographic groups most similar to Dominicans are Lumbee (19.7%, a difference of 0.66%), Navajo (19.4%, a difference of 1.2%), Immigrants from Cuba (19.9%, a difference of 1.5%), Immigrants from Dominican Republic (20.1%, a difference of 2.2%), and Tohono O'odham (19.1%, a difference of 2.5%).
| Demographics | Rating | Rank | Seniors Poverty Over the Age of 75 |
| Immigrants | Nicaragua | 0.0 /100 | #333 | Tragic 17.6% |
| Immigrants | Grenada | 0.0 /100 | #334 | Tragic 17.8% |
| Cubans | 0.0 /100 | #335 | Tragic 18.0% |
| Immigrants | Caribbean | 0.0 /100 | #336 | Tragic 18.2% |
| Yakama | 0.0 /100 | #337 | Tragic 18.3% |
| Immigrants | Cabo Verde | 0.0 /100 | #338 | Tragic 18.5% |
| Hopi | 0.0 /100 | #339 | Tragic 18.9% |
| Tohono O'odham | 0.0 /100 | #340 | Tragic 19.1% |
| Navajo | 0.0 /100 | #341 | Tragic 19.4% |
| Dominicans | 0.0 /100 | #342 | Tragic 19.6% |
| Lumbee | 0.0 /100 | #343 | Tragic 19.7% |
| Immigrants | Cuba | 0.0 /100 | #344 | Tragic 19.9% |
| Immigrants | Dominican Republic | 0.0 /100 | #345 | Tragic 20.1% |
| Puerto Ricans | 0.0 /100 | #346 | Tragic 23.2% |
| Pima | 0.0 /100 | #347 | Tragic 23.9% |
Demographics Similar to Iroquois by Seniors Poverty Over the Age of 75
In terms of seniors poverty over the age of 75, the demographic groups most similar to Iroquois are Cajun (14.0%, a difference of 0.13%), Ghanaian (14.0%, a difference of 0.36%), Immigrants (13.9%, a difference of 0.46%), Immigrants from Portugal (13.9%, a difference of 0.53%), and Immigrants from Panama (13.9%, a difference of 0.57%).
| Demographics | Rating | Rank | Seniors Poverty Over the Age of 75 |
| Inupiat | 0.1 /100 | #256 | Tragic 13.8% |
| Immigrants | Western Africa | 0.1 /100 | #257 | Tragic 13.9% |
| Immigrants | Panama | 0.1 /100 | #258 | Tragic 13.9% |
| Immigrants | Portugal | 0.1 /100 | #259 | Tragic 13.9% |
| Immigrants | Immigrants | 0.1 /100 | #260 | Tragic 13.9% |
| Ghanaians | 0.1 /100 | #261 | Tragic 14.0% |
| Cajuns | 0.1 /100 | #262 | Tragic 14.0% |
| Iroquois | 0.1 /100 | #263 | Tragic 14.0% |
| South Americans | 0.0 /100 | #264 | Tragic 14.1% |
| Salvadorans | 0.0 /100 | #265 | Tragic 14.2% |
| Armenians | 0.0 /100 | #266 | Tragic 14.2% |
| Venezuelans | 0.0 /100 | #267 | Tragic 14.2% |
| Colombians | 0.0 /100 | #268 | Tragic 14.3% |
| Immigrants | Venezuela | 0.0 /100 | #269 | Tragic 14.3% |
| Immigrants | Uruguay | 0.0 /100 | #270 | Tragic 14.3% |