Czech vs Bermudan Male Poverty
COMPARE
Czech
Bermudan
Male Poverty
Male Poverty Comparison
Czechs
Bermudans
9.8%
MALE POVERTY
99.4/ 100
METRIC RATING
36th/ 347
METRIC RANK
12.2%
MALE POVERTY
2.4/ 100
METRIC RATING
219th/ 347
METRIC RANK
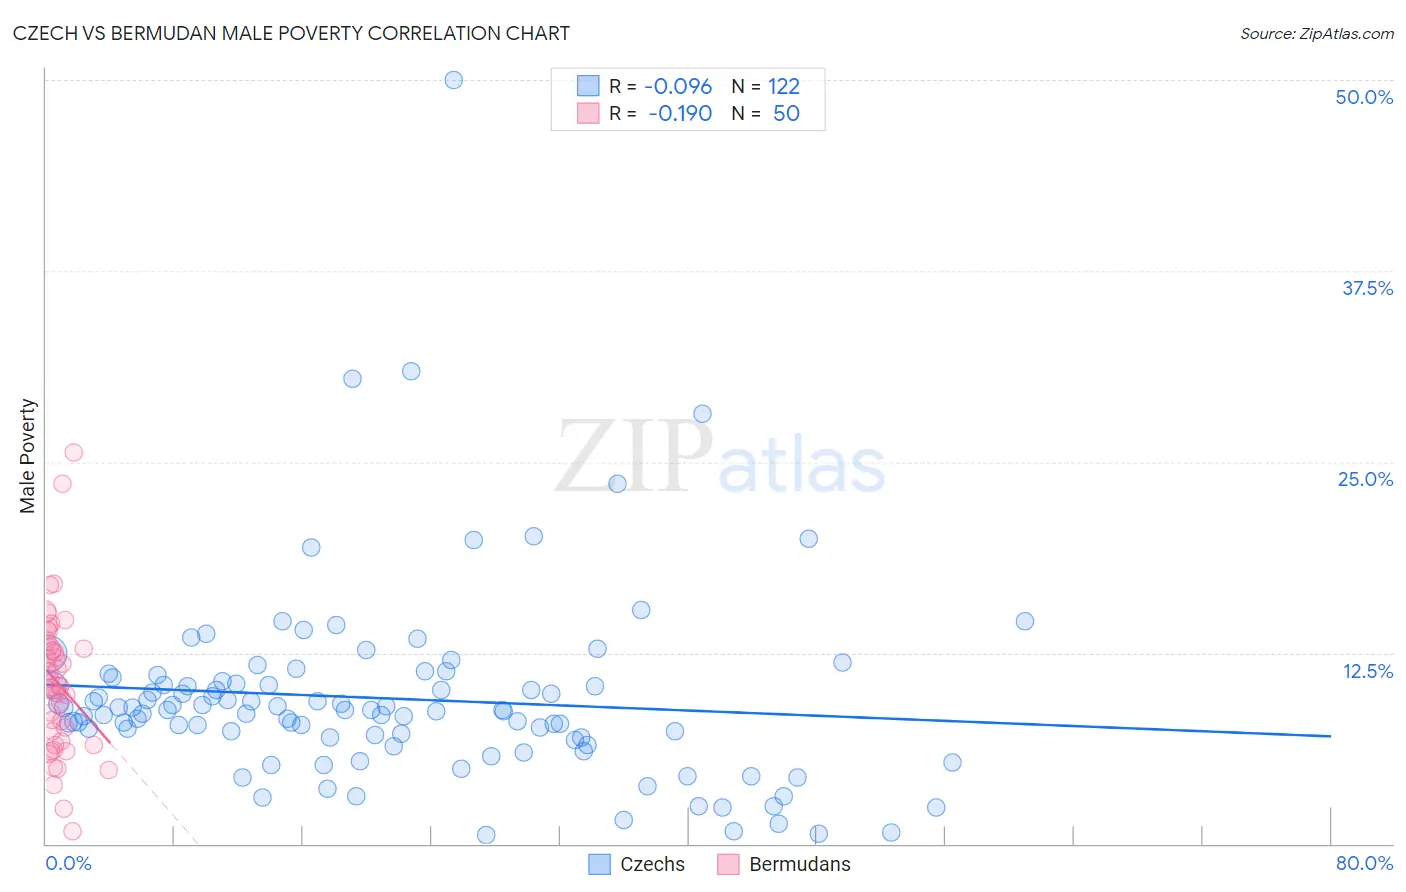
Czech vs Bermudan Male Poverty Correlation Chart
The statistical analysis conducted on geographies consisting of 484,041,978 people shows a slight negative correlation between the proportion of Czechs and poverty level among males in the United States with a correlation coefficient (R) of -0.096 and weighted average of 9.8%. Similarly, the statistical analysis conducted on geographies consisting of 55,715,607 people shows a poor negative correlation between the proportion of Bermudans and poverty level among males in the United States with a correlation coefficient (R) of -0.190 and weighted average of 12.2%, a difference of 24.6%.
Male Poverty Correlation Summary
| Measurement | Czech | Bermudan |
| Minimum | 0.55% | 0.81% |
| Maximum | 50.0% | 25.6% |
| Range | 49.5% | 24.8% |
| Mean | 9.5% | 10.5% |
| Median | 8.7% | 10.3% |
| Interquartile 25% (IQ1) | 7.0% | 6.7% |
| Interquartile 75% (IQ3) | 10.4% | 12.9% |
| Interquartile Range (IQR) | 3.5% | 6.2% |
| Standard Deviation (Sample) | 6.4% | 4.7% |
| Standard Deviation (Population) | 6.4% | 4.7% |
Similar Demographics by Male Poverty
Demographics Similar to Czechs by Male Poverty
In terms of male poverty, the demographic groups most similar to Czechs are Iranian (9.8%, a difference of 0.090%), Immigrants from Greece (9.8%, a difference of 0.22%), Immigrants from Poland (9.8%, a difference of 0.39%), Immigrants from Northern Europe (9.7%, a difference of 0.54%), and Immigrants from Pakistan (9.9%, a difference of 0.59%).
| Demographics | Rating | Rank | Male Poverty |
| Greeks | 99.6 /100 | #29 | Exceptional 9.7% |
| Poles | 99.5 /100 | #30 | Exceptional 9.7% |
| Tongans | 99.5 /100 | #31 | Exceptional 9.7% |
| Macedonians | 99.5 /100 | #32 | Exceptional 9.7% |
| Immigrants | Northern Europe | 99.5 /100 | #33 | Exceptional 9.7% |
| Immigrants | Poland | 99.5 /100 | #34 | Exceptional 9.8% |
| Iranians | 99.4 /100 | #35 | Exceptional 9.8% |
| Czechs | 99.4 /100 | #36 | Exceptional 9.8% |
| Immigrants | Greece | 99.3 /100 | #37 | Exceptional 9.8% |
| Immigrants | Pakistan | 99.2 /100 | #38 | Exceptional 9.9% |
| Russians | 99.2 /100 | #39 | Exceptional 9.9% |
| Cypriots | 99.2 /100 | #40 | Exceptional 9.9% |
| Koreans | 99.2 /100 | #41 | Exceptional 9.9% |
| Immigrants | Iran | 99.1 /100 | #42 | Exceptional 9.9% |
| Immigrants | Moldova | 99.0 /100 | #43 | Exceptional 9.9% |
Demographics Similar to Bermudans by Male Poverty
In terms of male poverty, the demographic groups most similar to Bermudans are Immigrants from Eritrea (12.2%, a difference of 0.020%), German Russian (12.2%, a difference of 0.070%), Immigrants from Thailand (12.2%, a difference of 0.090%), Immigrants from Cambodia (12.2%, a difference of 0.10%), and Immigrants from Uzbekistan (12.2%, a difference of 0.18%).
| Demographics | Rating | Rank | Male Poverty |
| Americans | 3.2 /100 | #212 | Tragic 12.1% |
| Immigrants | Nonimmigrants | 3.1 /100 | #213 | Tragic 12.1% |
| Japanese | 2.7 /100 | #214 | Tragic 12.2% |
| Immigrants | Uzbekistan | 2.6 /100 | #215 | Tragic 12.2% |
| Immigrants | Cambodia | 2.5 /100 | #216 | Tragic 12.2% |
| Immigrants | Thailand | 2.5 /100 | #217 | Tragic 12.2% |
| German Russians | 2.5 /100 | #218 | Tragic 12.2% |
| Bermudans | 2.4 /100 | #219 | Tragic 12.2% |
| Immigrants | Eritrea | 2.4 /100 | #220 | Tragic 12.2% |
| Ugandans | 2.2 /100 | #221 | Tragic 12.2% |
| Immigrants | Africa | 2.1 /100 | #222 | Tragic 12.2% |
| Immigrants | Micronesia | 2.1 /100 | #223 | Tragic 12.2% |
| Immigrants | Nigeria | 1.6 /100 | #224 | Tragic 12.3% |
| Osage | 1.5 /100 | #225 | Tragic 12.3% |
| Nigerians | 1.4 /100 | #226 | Tragic 12.3% |