Danish vs Iraqi Receiving Food Stamps
COMPARE
Danish
Iraqi
Receiving Food Stamps
Receiving Food Stamps Comparison
Danes
Iraqis
9.0%
RECEIVING FOOD STAMPS
99.9/ 100
METRIC RATING
18th/ 347
METRIC RANK
12.2%
RECEIVING FOOD STAMPS
26.6/ 100
METRIC RATING
196th/ 347
METRIC RANK
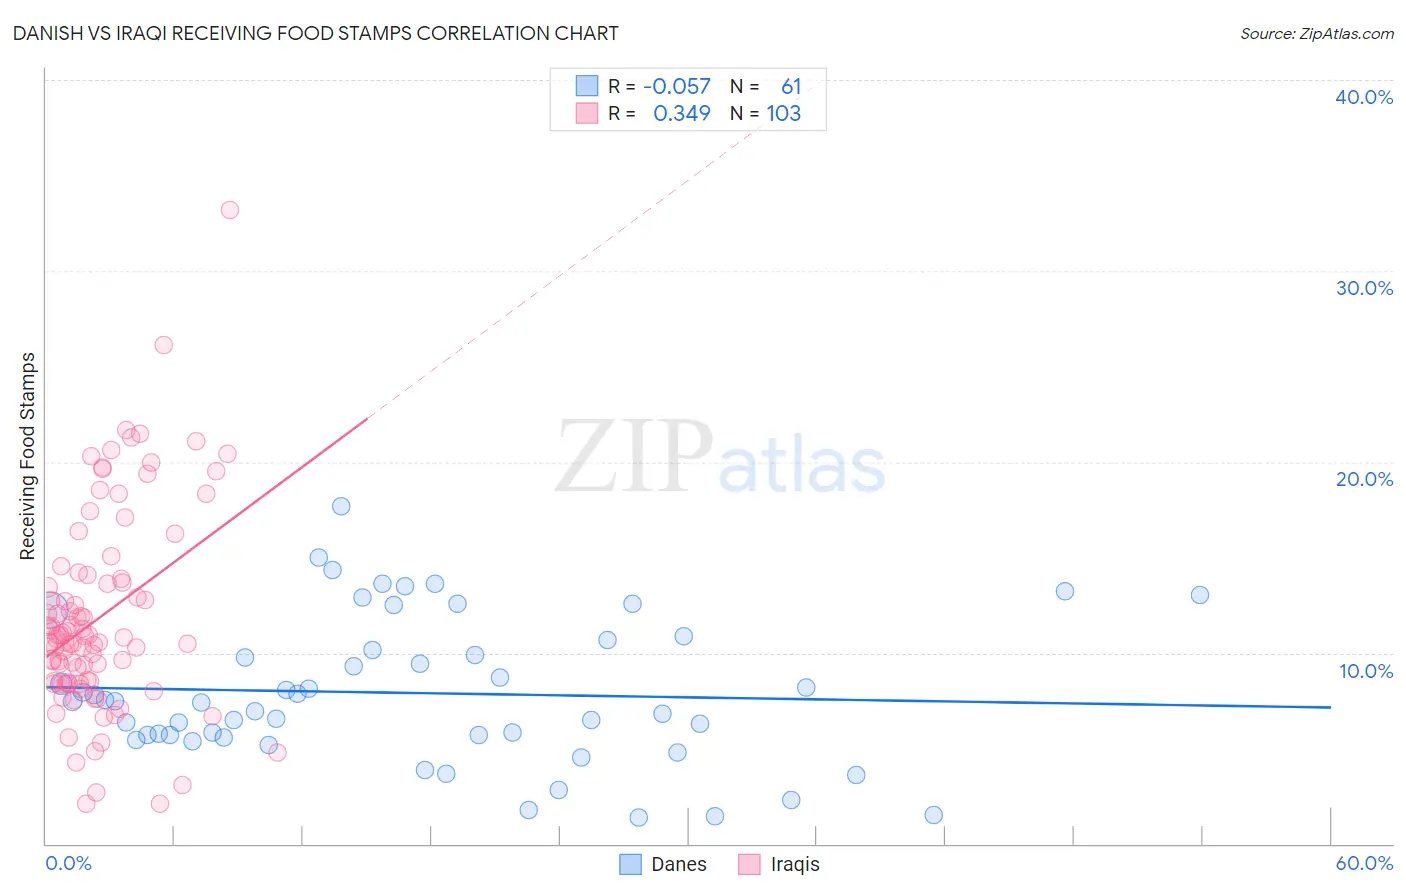
Danish vs Iraqi Receiving Food Stamps Correlation Chart
The statistical analysis conducted on geographies consisting of 472,155,016 people shows a slight negative correlation between the proportion of Danes and percentage of population receiving government assistance and/or food stamps in the United States with a correlation coefficient (R) of -0.057 and weighted average of 9.0%. Similarly, the statistical analysis conducted on geographies consisting of 170,465,445 people shows a mild positive correlation between the proportion of Iraqis and percentage of population receiving government assistance and/or food stamps in the United States with a correlation coefficient (R) of 0.349 and weighted average of 12.2%, a difference of 34.5%.
Receiving Food Stamps Correlation Summary
| Measurement | Danish | Iraqi |
| Minimum | 1.4% | 2.1% |
| Maximum | 17.7% | 33.2% |
| Range | 16.3% | 31.1% |
| Mean | 7.9% | 11.8% |
| Median | 7.4% | 10.8% |
| Interquartile 25% (IQ1) | 5.6% | 8.4% |
| Interquartile 75% (IQ3) | 10.4% | 13.9% |
| Interquartile Range (IQR) | 4.8% | 5.5% |
| Standard Deviation (Sample) | 3.7% | 5.3% |
| Standard Deviation (Population) | 3.7% | 5.2% |
Similar Demographics by Receiving Food Stamps
Demographics Similar to Danes by Receiving Food Stamps
In terms of receiving food stamps, the demographic groups most similar to Danes are Immigrants from Scotland (9.0%, a difference of 0.45%), Immigrants from Hong Kong (9.1%, a difference of 0.58%), Immigrants from Japan (9.0%, a difference of 0.61%), Norwegian (9.0%, a difference of 0.88%), and Latvian (9.1%, a difference of 0.91%).
| Demographics | Rating | Rank | Receiving Food Stamps |
| Okinawans | 99.9 /100 | #11 | Exceptional 8.9% |
| Cypriots | 99.9 /100 | #12 | Exceptional 8.9% |
| Bulgarians | 99.9 /100 | #13 | Exceptional 8.9% |
| Maltese | 99.9 /100 | #14 | Exceptional 8.9% |
| Norwegians | 99.9 /100 | #15 | Exceptional 9.0% |
| Immigrants | Japan | 99.9 /100 | #16 | Exceptional 9.0% |
| Immigrants | Scotland | 99.9 /100 | #17 | Exceptional 9.0% |
| Danes | 99.9 /100 | #18 | Exceptional 9.0% |
| Immigrants | Hong Kong | 99.8 /100 | #19 | Exceptional 9.1% |
| Latvians | 99.8 /100 | #20 | Exceptional 9.1% |
| Luxembourgers | 99.8 /100 | #21 | Exceptional 9.1% |
| Immigrants | Australia | 99.8 /100 | #22 | Exceptional 9.2% |
| Eastern Europeans | 99.8 /100 | #23 | Exceptional 9.2% |
| Immigrants | Northern Europe | 99.8 /100 | #24 | Exceptional 9.2% |
| Immigrants | Ireland | 99.8 /100 | #25 | Exceptional 9.2% |
Demographics Similar to Iraqis by Receiving Food Stamps
In terms of receiving food stamps, the demographic groups most similar to Iraqis are American (12.2%, a difference of 0.030%), Delaware (12.2%, a difference of 0.080%), Immigrants from Sudan (12.1%, a difference of 0.090%), Immigrants from Fiji (12.1%, a difference of 0.21%), and Immigrants from Costa Rica (12.2%, a difference of 0.21%).
| Demographics | Rating | Rank | Receiving Food Stamps |
| Immigrants | Cameroon | 32.5 /100 | #189 | Fair 12.0% |
| Immigrants | Peru | 32.2 /100 | #190 | Fair 12.0% |
| Venezuelans | 32.1 /100 | #191 | Fair 12.0% |
| Samoans | 31.0 /100 | #192 | Fair 12.1% |
| Immigrants | Fiji | 27.8 /100 | #193 | Fair 12.1% |
| Immigrants | Sudan | 27.1 /100 | #194 | Fair 12.1% |
| Americans | 26.7 /100 | #195 | Fair 12.2% |
| Iraqis | 26.6 /100 | #196 | Fair 12.2% |
| Delaware | 26.1 /100 | #197 | Fair 12.2% |
| Immigrants | Costa Rica | 25.4 /100 | #198 | Fair 12.2% |
| Portuguese | 25.1 /100 | #199 | Fair 12.2% |
| Sierra Leoneans | 23.6 /100 | #200 | Fair 12.2% |
| Ugandans | 22.5 /100 | #201 | Fair 12.2% |
| Immigrants | Venezuela | 20.1 /100 | #202 | Fair 12.3% |
| Shoshone | 17.7 /100 | #203 | Poor 12.4% |