Danish vs Immigrants from Honduras Child Poverty Among Boys Under 16
COMPARE
Danish
Immigrants from Honduras
Child Poverty Among Boys Under 16
Child Poverty Among Boys Under 16 Comparison
Danes
Immigrants from Honduras
13.6%
CHILD POVERTY AMONG BOYS UNDER 16
99.8/ 100
METRIC RATING
33rd/ 347
METRIC RANK
22.8%
CHILD POVERTY AMONG BOYS UNDER 16
0.0/ 100
METRIC RATING
327th/ 347
METRIC RANK
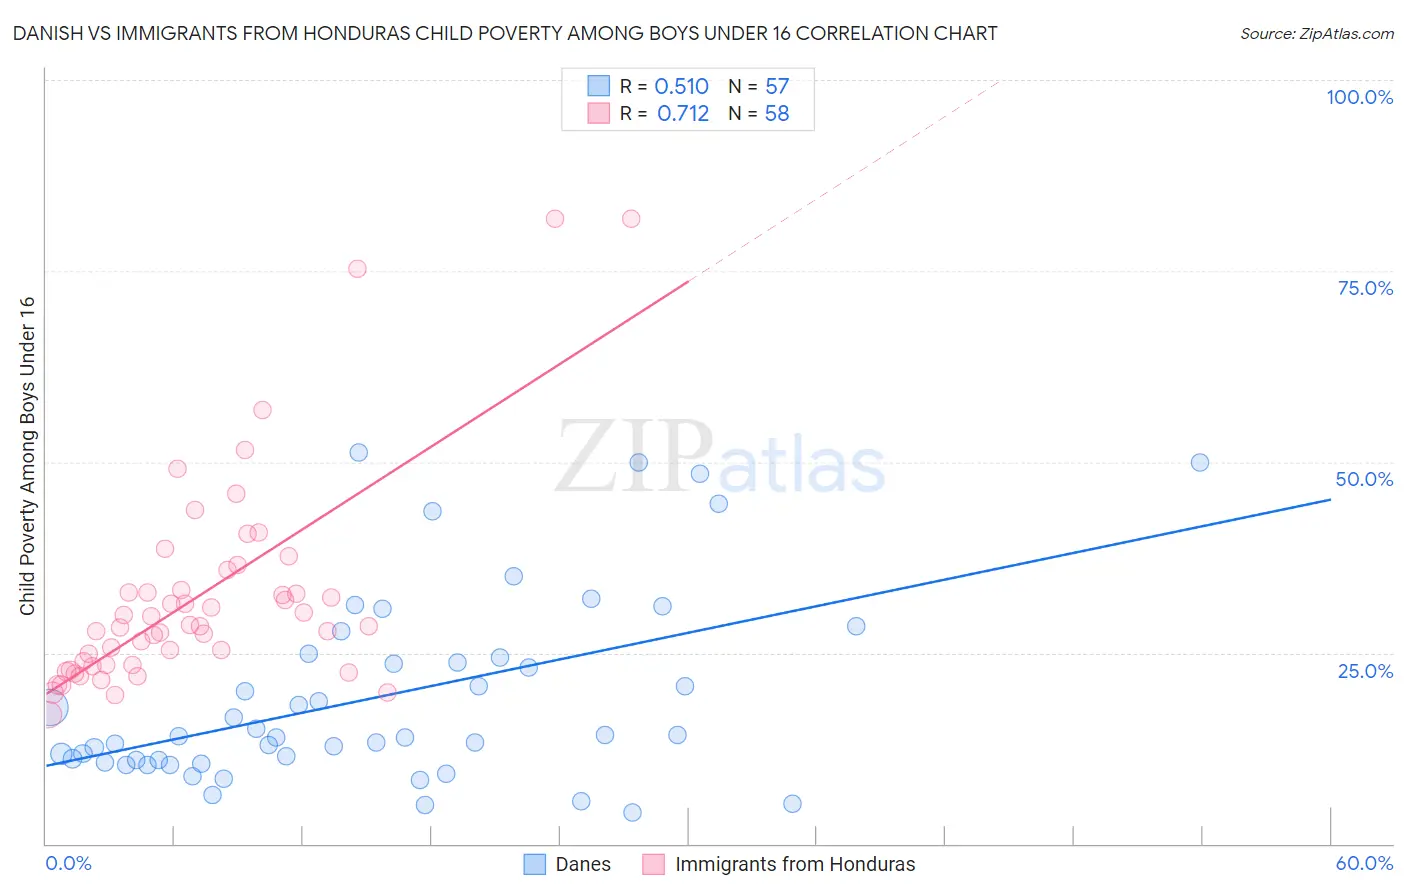
Danish vs Immigrants from Honduras Child Poverty Among Boys Under 16 Correlation Chart
The statistical analysis conducted on geographies consisting of 461,554,581 people shows a substantial positive correlation between the proportion of Danes and poverty level among boys under the age of 16 in the United States with a correlation coefficient (R) of 0.510 and weighted average of 13.6%. Similarly, the statistical analysis conducted on geographies consisting of 320,355,398 people shows a strong positive correlation between the proportion of Immigrants from Honduras and poverty level among boys under the age of 16 in the United States with a correlation coefficient (R) of 0.712 and weighted average of 22.8%, a difference of 67.4%.
Child Poverty Among Boys Under 16 Correlation Summary
| Measurement | Danish | Immigrants from Honduras |
| Minimum | 4.1% | 16.9% |
| Maximum | 51.2% | 81.8% |
| Range | 47.0% | 65.0% |
| Mean | 19.3% | 32.3% |
| Median | 14.1% | 28.4% |
| Interquartile 25% (IQ1) | 10.8% | 23.3% |
| Interquartile 75% (IQ3) | 24.6% | 33.2% |
| Interquartile Range (IQR) | 13.8% | 9.9% |
| Standard Deviation (Sample) | 12.4% | 13.9% |
| Standard Deviation (Population) | 12.3% | 13.8% |
Similar Demographics by Child Poverty Among Boys Under 16
Demographics Similar to Danes by Child Poverty Among Boys Under 16
In terms of child poverty among boys under 16, the demographic groups most similar to Danes are Assyrian/Chaldean/Syriac (13.6%, a difference of 0.11%), Immigrants from China (13.6%, a difference of 0.18%), Turkish (13.6%, a difference of 0.27%), Swedish (13.6%, a difference of 0.35%), and Cypriot (13.6%, a difference of 0.45%).
| Demographics | Rating | Rank | Child Poverty Among Boys Under 16 |
| Immigrants | Bolivia | 99.8 /100 | #26 | Exceptional 13.5% |
| Asians | 99.8 /100 | #27 | Exceptional 13.5% |
| Eastern Europeans | 99.8 /100 | #28 | Exceptional 13.5% |
| Cypriots | 99.8 /100 | #29 | Exceptional 13.6% |
| Swedes | 99.8 /100 | #30 | Exceptional 13.6% |
| Turks | 99.8 /100 | #31 | Exceptional 13.6% |
| Immigrants | China | 99.8 /100 | #32 | Exceptional 13.6% |
| Danes | 99.8 /100 | #33 | Exceptional 13.6% |
| Assyrians/Chaldeans/Syriacs | 99.8 /100 | #34 | Exceptional 13.6% |
| Russians | 99.7 /100 | #35 | Exceptional 13.8% |
| Luxembourgers | 99.7 /100 | #36 | Exceptional 13.8% |
| Immigrants | Sri Lanka | 99.6 /100 | #37 | Exceptional 13.9% |
| Immigrants | Northern Europe | 99.6 /100 | #38 | Exceptional 13.9% |
| Immigrants | Australia | 99.6 /100 | #39 | Exceptional 13.9% |
| Immigrants | Asia | 99.6 /100 | #40 | Exceptional 13.9% |
Demographics Similar to Immigrants from Honduras by Child Poverty Among Boys Under 16
In terms of child poverty among boys under 16, the demographic groups most similar to Immigrants from Honduras are Paiute (22.8%, a difference of 0.12%), Central American Indian (22.5%, a difference of 1.3%), Immigrants from Congo (22.4%, a difference of 1.8%), Honduran (22.3%, a difference of 2.1%), and Immigrants from Dominica (22.2%, a difference of 2.7%).
| Demographics | Rating | Rank | Child Poverty Among Boys Under 16 |
| U.S. Virgin Islanders | 0.0 /100 | #320 | Tragic 22.0% |
| Cajuns | 0.0 /100 | #321 | Tragic 22.2% |
| Immigrants | Dominica | 0.0 /100 | #322 | Tragic 22.2% |
| Hondurans | 0.0 /100 | #323 | Tragic 22.3% |
| Immigrants | Congo | 0.0 /100 | #324 | Tragic 22.4% |
| Central American Indians | 0.0 /100 | #325 | Tragic 22.5% |
| Paiute | 0.0 /100 | #326 | Tragic 22.8% |
| Immigrants | Honduras | 0.0 /100 | #327 | Tragic 22.8% |
| Pueblo | 0.0 /100 | #328 | Tragic 23.5% |
| Natives/Alaskans | 0.0 /100 | #329 | Tragic 24.0% |
| Colville | 0.0 /100 | #330 | Tragic 24.1% |
| Dominicans | 0.0 /100 | #331 | Tragic 24.2% |
| Immigrants | Dominican Republic | 0.0 /100 | #332 | Tragic 24.3% |
| Apache | 0.0 /100 | #333 | Tragic 24.5% |
| Blacks/African Americans | 0.0 /100 | #334 | Tragic 24.5% |