Paraguayan vs Immigrants from Honduras Child Poverty Among Boys Under 16
COMPARE
Paraguayan
Immigrants from Honduras
Child Poverty Among Boys Under 16
Child Poverty Among Boys Under 16 Comparison
Paraguayans
Immigrants from Honduras
14.9%
CHILD POVERTY AMONG BOYS UNDER 16
96.8/ 100
METRIC RATING
91st/ 347
METRIC RANK
22.8%
CHILD POVERTY AMONG BOYS UNDER 16
0.0/ 100
METRIC RATING
327th/ 347
METRIC RANK
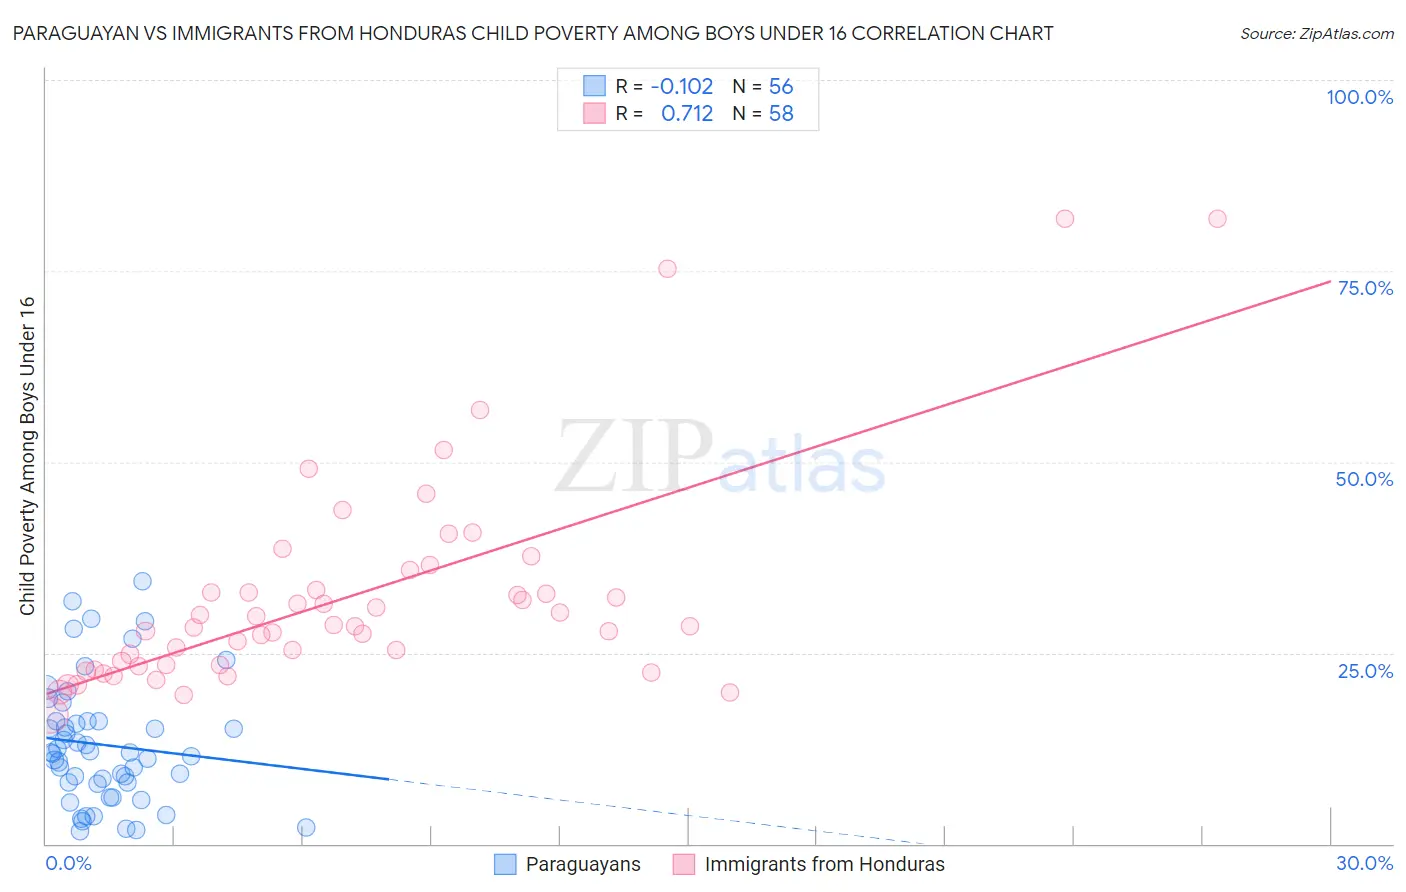
Paraguayan vs Immigrants from Honduras Child Poverty Among Boys Under 16 Correlation Chart
The statistical analysis conducted on geographies consisting of 94,464,769 people shows a poor negative correlation between the proportion of Paraguayans and poverty level among boys under the age of 16 in the United States with a correlation coefficient (R) of -0.102 and weighted average of 14.9%. Similarly, the statistical analysis conducted on geographies consisting of 320,355,398 people shows a strong positive correlation between the proportion of Immigrants from Honduras and poverty level among boys under the age of 16 in the United States with a correlation coefficient (R) of 0.712 and weighted average of 22.8%, a difference of 53.3%.
Child Poverty Among Boys Under 16 Correlation Summary
| Measurement | Paraguayan | Immigrants from Honduras |
| Minimum | 1.7% | 16.9% |
| Maximum | 34.4% | 81.8% |
| Range | 32.7% | 65.0% |
| Mean | 12.9% | 32.3% |
| Median | 11.9% | 28.4% |
| Interquartile 25% (IQ1) | 7.9% | 23.3% |
| Interquartile 75% (IQ3) | 16.0% | 33.2% |
| Interquartile Range (IQR) | 8.1% | 9.9% |
| Standard Deviation (Sample) | 8.1% | 13.9% |
| Standard Deviation (Population) | 8.0% | 13.8% |
Similar Demographics by Child Poverty Among Boys Under 16
Demographics Similar to Paraguayans by Child Poverty Among Boys Under 16
In terms of child poverty among boys under 16, the demographic groups most similar to Paraguayans are Argentinean (14.9%, a difference of 0.080%), Sri Lankan (14.9%, a difference of 0.13%), Immigrants from Italy (14.9%, a difference of 0.13%), Finnish (14.9%, a difference of 0.23%), and Austrian (14.8%, a difference of 0.30%).
| Demographics | Rating | Rank | Child Poverty Among Boys Under 16 |
| Swiss | 97.3 /100 | #84 | Exceptional 14.8% |
| Taiwanese | 97.3 /100 | #85 | Exceptional 14.8% |
| Germans | 97.2 /100 | #86 | Exceptional 14.8% |
| Northern Europeans | 97.2 /100 | #87 | Exceptional 14.8% |
| Immigrants | North America | 97.1 /100 | #88 | Exceptional 14.8% |
| Immigrants | Argentina | 97.1 /100 | #89 | Exceptional 14.8% |
| Austrians | 97.1 /100 | #90 | Exceptional 14.8% |
| Paraguayans | 96.8 /100 | #91 | Exceptional 14.9% |
| Argentineans | 96.7 /100 | #92 | Exceptional 14.9% |
| Sri Lankans | 96.7 /100 | #93 | Exceptional 14.9% |
| Immigrants | Italy | 96.7 /100 | #94 | Exceptional 14.9% |
| Finns | 96.5 /100 | #95 | Exceptional 14.9% |
| Immigrants | North Macedonia | 96.3 /100 | #96 | Exceptional 14.9% |
| Immigrants | Egypt | 96.2 /100 | #97 | Exceptional 14.9% |
| British | 96.2 /100 | #98 | Exceptional 15.0% |
Demographics Similar to Immigrants from Honduras by Child Poverty Among Boys Under 16
In terms of child poverty among boys under 16, the demographic groups most similar to Immigrants from Honduras are Paiute (22.8%, a difference of 0.12%), Central American Indian (22.5%, a difference of 1.3%), Immigrants from Congo (22.4%, a difference of 1.8%), Honduran (22.3%, a difference of 2.1%), and Immigrants from Dominica (22.2%, a difference of 2.7%).
| Demographics | Rating | Rank | Child Poverty Among Boys Under 16 |
| U.S. Virgin Islanders | 0.0 /100 | #320 | Tragic 22.0% |
| Cajuns | 0.0 /100 | #321 | Tragic 22.2% |
| Immigrants | Dominica | 0.0 /100 | #322 | Tragic 22.2% |
| Hondurans | 0.0 /100 | #323 | Tragic 22.3% |
| Immigrants | Congo | 0.0 /100 | #324 | Tragic 22.4% |
| Central American Indians | 0.0 /100 | #325 | Tragic 22.5% |
| Paiute | 0.0 /100 | #326 | Tragic 22.8% |
| Immigrants | Honduras | 0.0 /100 | #327 | Tragic 22.8% |
| Pueblo | 0.0 /100 | #328 | Tragic 23.5% |
| Natives/Alaskans | 0.0 /100 | #329 | Tragic 24.0% |
| Colville | 0.0 /100 | #330 | Tragic 24.1% |
| Dominicans | 0.0 /100 | #331 | Tragic 24.2% |
| Immigrants | Dominican Republic | 0.0 /100 | #332 | Tragic 24.3% |
| Apache | 0.0 /100 | #333 | Tragic 24.5% |
| Blacks/African Americans | 0.0 /100 | #334 | Tragic 24.5% |