Danish vs Immigrants from Honduras No Schooling Completed
COMPARE
Danish
Immigrants from Honduras
No Schooling Completed
No Schooling Completed Comparison
Danes
Immigrants from Honduras
1.5%
NO SCHOOLING COMPLETED
100.0/ 100
METRIC RATING
18th/ 347
METRIC RANK
3.2%
NO SCHOOLING COMPLETED
0.0/ 100
METRIC RATING
322nd/ 347
METRIC RANK
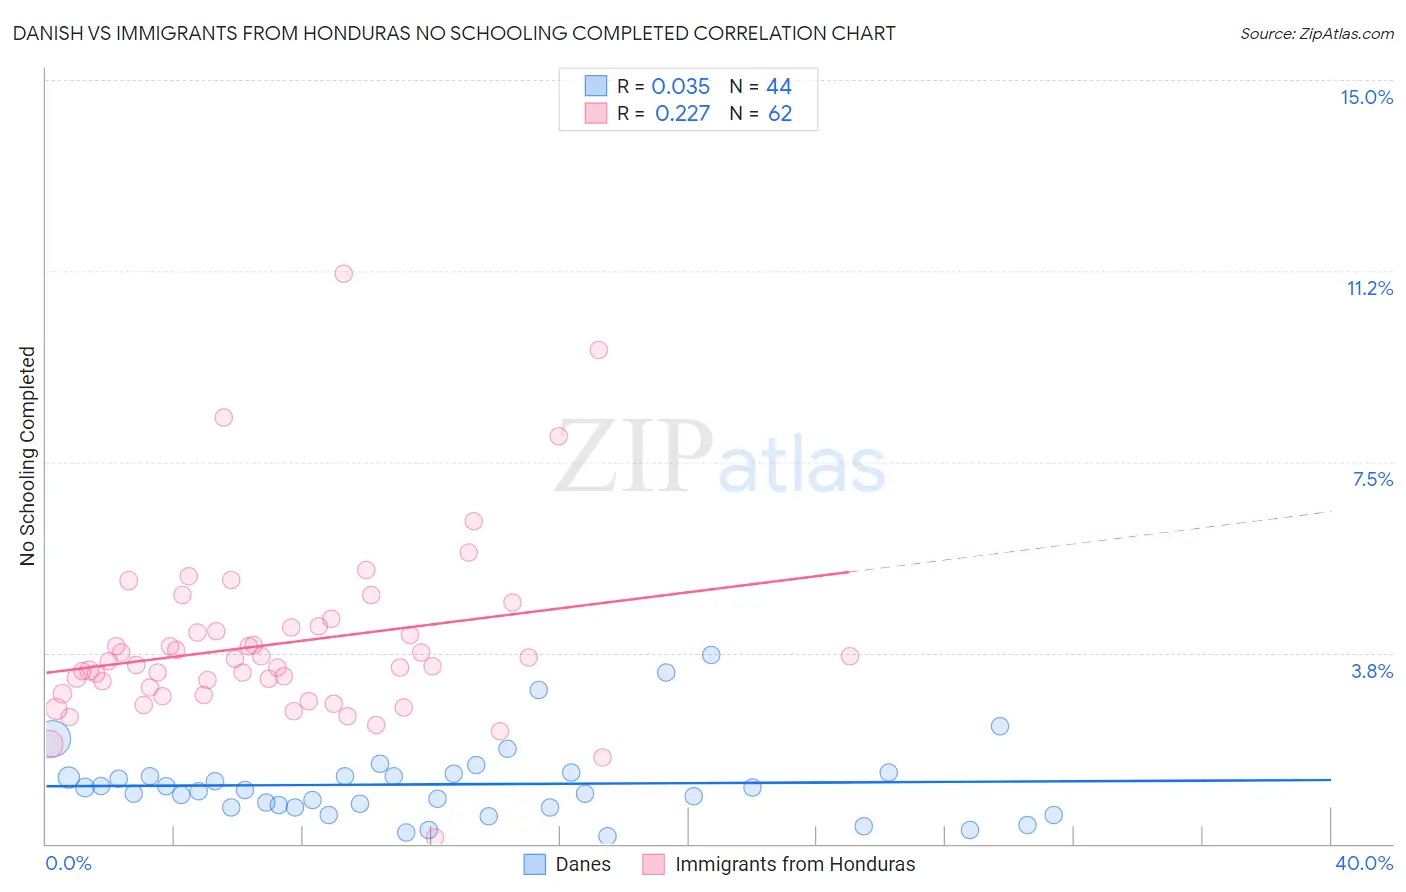
Danish vs Immigrants from Honduras No Schooling Completed Correlation Chart
The statistical analysis conducted on geographies consisting of 463,663,322 people shows no correlation between the proportion of Danes and percentage of population with no schooling in the United States with a correlation coefficient (R) of 0.035 and weighted average of 1.5%. Similarly, the statistical analysis conducted on geographies consisting of 321,294,149 people shows a weak positive correlation between the proportion of Immigrants from Honduras and percentage of population with no schooling in the United States with a correlation coefficient (R) of 0.227 and weighted average of 3.2%, a difference of 116.5%.
No Schooling Completed Correlation Summary
| Measurement | Danish | Immigrants from Honduras |
| Minimum | 0.15% | 0.12% |
| Maximum | 3.7% | 11.2% |
| Range | 3.6% | 11.1% |
| Mean | 1.2% | 3.9% |
| Median | 1.0% | 3.5% |
| Interquartile 25% (IQ1) | 0.72% | 2.9% |
| Interquartile 75% (IQ3) | 1.3% | 4.3% |
| Interquartile Range (IQR) | 0.62% | 1.3% |
| Standard Deviation (Sample) | 0.77% | 1.8% |
| Standard Deviation (Population) | 0.76% | 1.8% |
Similar Demographics by No Schooling Completed
Demographics Similar to Danes by No Schooling Completed
In terms of no schooling completed, the demographic groups most similar to Danes are Alaskan Athabascan (1.5%, a difference of 0.10%), Welsh (1.5%, a difference of 0.23%), Croatian (1.5%, a difference of 0.30%), Finnish (1.5%, a difference of 0.31%), and Chinese (1.5%, a difference of 0.60%).
| Demographics | Rating | Rank | No Schooling Completed |
| Lithuanians | 100.0 /100 | #11 | Exceptional 1.4% |
| Irish | 100.0 /100 | #12 | Exceptional 1.4% |
| Poles | 100.0 /100 | #13 | Exceptional 1.4% |
| Scotch-Irish | 100.0 /100 | #14 | Exceptional 1.5% |
| Tlingit-Haida | 100.0 /100 | #15 | Exceptional 1.5% |
| Finns | 100.0 /100 | #16 | Exceptional 1.5% |
| Croatians | 100.0 /100 | #17 | Exceptional 1.5% |
| Danes | 100.0 /100 | #18 | Exceptional 1.5% |
| Alaskan Athabascans | 100.0 /100 | #19 | Exceptional 1.5% |
| Welsh | 100.0 /100 | #20 | Exceptional 1.5% |
| Chinese | 100.0 /100 | #21 | Exceptional 1.5% |
| Alaska Natives | 100.0 /100 | #22 | Exceptional 1.5% |
| Europeans | 100.0 /100 | #23 | Exceptional 1.5% |
| Pennsylvania Germans | 100.0 /100 | #24 | Exceptional 1.5% |
| French | 100.0 /100 | #25 | Exceptional 1.5% |
Demographics Similar to Immigrants from Honduras by No Schooling Completed
In terms of no schooling completed, the demographic groups most similar to Immigrants from Honduras are Vietnamese (3.2%, a difference of 0.19%), Mexican American Indian (3.2%, a difference of 0.53%), Immigrants from Laos (3.1%, a difference of 0.67%), Immigrants from Bangladesh (3.1%, a difference of 0.79%), and Immigrants from Burma/Myanmar (3.1%, a difference of 0.83%).
| Demographics | Rating | Rank | No Schooling Completed |
| Immigrants | Nicaragua | 0.0 /100 | #315 | Tragic 3.1% |
| Immigrants | Ecuador | 0.0 /100 | #316 | Tragic 3.1% |
| Cape Verdeans | 0.0 /100 | #317 | Tragic 3.1% |
| Immigrants | Guyana | 0.0 /100 | #318 | Tragic 3.1% |
| Immigrants | Burma/Myanmar | 0.0 /100 | #319 | Tragic 3.1% |
| Immigrants | Bangladesh | 0.0 /100 | #320 | Tragic 3.1% |
| Immigrants | Laos | 0.0 /100 | #321 | Tragic 3.1% |
| Immigrants | Honduras | 0.0 /100 | #322 | Tragic 3.2% |
| Vietnamese | 0.0 /100 | #323 | Tragic 3.2% |
| Mexican American Indians | 0.0 /100 | #324 | Tragic 3.2% |
| Dominicans | 0.0 /100 | #325 | Tragic 3.2% |
| Indonesians | 0.0 /100 | #326 | Tragic 3.2% |
| Immigrants | Latin America | 0.0 /100 | #327 | Tragic 3.3% |
| Mexicans | 0.0 /100 | #328 | Tragic 3.3% |
| Immigrants | Vietnam | 0.0 /100 | #329 | Tragic 3.3% |