Lebanese vs Immigrants from Honduras Child Poverty Among Boys Under 16
COMPARE
Lebanese
Immigrants from Honduras
Child Poverty Among Boys Under 16
Child Poverty Among Boys Under 16 Comparison
Lebanese
Immigrants from Honduras
16.6%
CHILD POVERTY AMONG BOYS UNDER 16
43.3/ 100
METRIC RATING
182nd/ 347
METRIC RANK
22.8%
CHILD POVERTY AMONG BOYS UNDER 16
0.0/ 100
METRIC RATING
327th/ 347
METRIC RANK
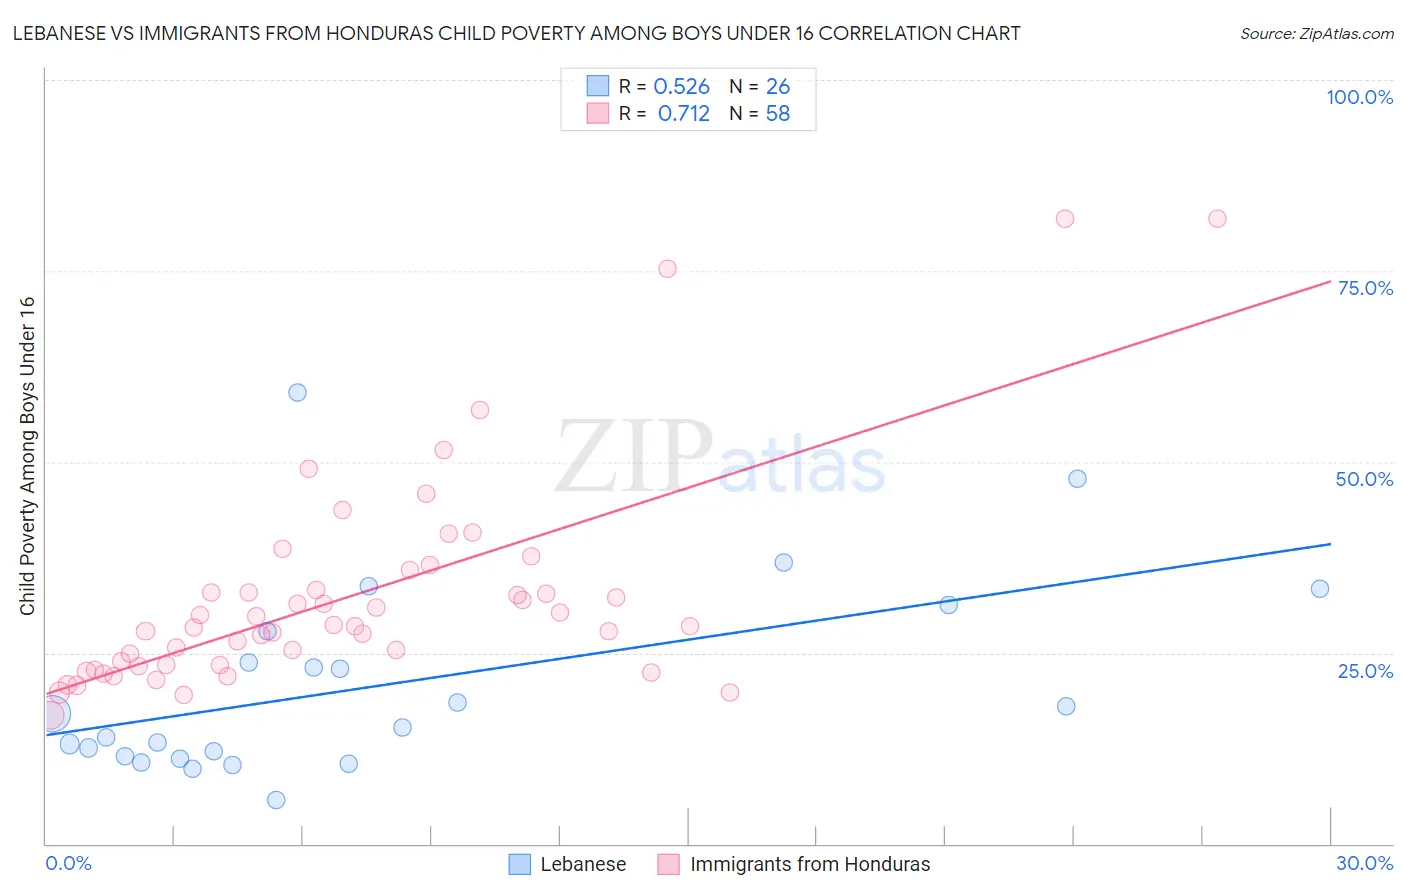
Lebanese vs Immigrants from Honduras Child Poverty Among Boys Under 16 Correlation Chart
The statistical analysis conducted on geographies consisting of 393,704,945 people shows a substantial positive correlation between the proportion of Lebanese and poverty level among boys under the age of 16 in the United States with a correlation coefficient (R) of 0.526 and weighted average of 16.6%. Similarly, the statistical analysis conducted on geographies consisting of 320,355,398 people shows a strong positive correlation between the proportion of Immigrants from Honduras and poverty level among boys under the age of 16 in the United States with a correlation coefficient (R) of 0.712 and weighted average of 22.8%, a difference of 37.7%.
Child Poverty Among Boys Under 16 Correlation Summary
| Measurement | Lebanese | Immigrants from Honduras |
| Minimum | 5.8% | 16.9% |
| Maximum | 59.1% | 81.8% |
| Range | 53.3% | 65.0% |
| Mean | 20.9% | 32.3% |
| Median | 16.1% | 28.4% |
| Interquartile 25% (IQ1) | 11.5% | 23.3% |
| Interquartile 75% (IQ3) | 27.9% | 33.2% |
| Interquartile Range (IQR) | 16.4% | 9.9% |
| Standard Deviation (Sample) | 12.9% | 13.9% |
| Standard Deviation (Population) | 12.7% | 13.8% |
Similar Demographics by Child Poverty Among Boys Under 16
Demographics Similar to Lebanese by Child Poverty Among Boys Under 16
In terms of child poverty among boys under 16, the demographic groups most similar to Lebanese are South American Indian (16.5%, a difference of 0.11%), Hawaiian (16.5%, a difference of 0.25%), Kenyan (16.6%, a difference of 0.27%), Celtic (16.6%, a difference of 0.30%), and Immigrants from Western Asia (16.6%, a difference of 0.34%).
| Demographics | Rating | Rank | Child Poverty Among Boys Under 16 |
| Immigrants | Syria | 49.0 /100 | #175 | Average 16.5% |
| Whites/Caucasians | 48.2 /100 | #176 | Average 16.5% |
| Ethiopians | 47.8 /100 | #177 | Average 16.5% |
| Scotch-Irish | 47.5 /100 | #178 | Average 16.5% |
| Hungarians | 47.3 /100 | #179 | Average 16.5% |
| Hawaiians | 45.5 /100 | #180 | Average 16.5% |
| South American Indians | 44.3 /100 | #181 | Average 16.5% |
| Lebanese | 43.3 /100 | #182 | Average 16.6% |
| Kenyans | 41.0 /100 | #183 | Average 16.6% |
| Celtics | 40.6 /100 | #184 | Average 16.6% |
| Immigrants | Western Asia | 40.4 /100 | #185 | Average 16.6% |
| Hmong | 38.4 /100 | #186 | Fair 16.6% |
| Immigrants | Costa Rica | 37.8 /100 | #187 | Fair 16.7% |
| Immigrants | South America | 37.7 /100 | #188 | Fair 16.7% |
| Immigrants | Morocco | 34.5 /100 | #189 | Fair 16.7% |
Demographics Similar to Immigrants from Honduras by Child Poverty Among Boys Under 16
In terms of child poverty among boys under 16, the demographic groups most similar to Immigrants from Honduras are Paiute (22.8%, a difference of 0.12%), Central American Indian (22.5%, a difference of 1.3%), Immigrants from Congo (22.4%, a difference of 1.8%), Honduran (22.3%, a difference of 2.1%), and Immigrants from Dominica (22.2%, a difference of 2.7%).
| Demographics | Rating | Rank | Child Poverty Among Boys Under 16 |
| U.S. Virgin Islanders | 0.0 /100 | #320 | Tragic 22.0% |
| Cajuns | 0.0 /100 | #321 | Tragic 22.2% |
| Immigrants | Dominica | 0.0 /100 | #322 | Tragic 22.2% |
| Hondurans | 0.0 /100 | #323 | Tragic 22.3% |
| Immigrants | Congo | 0.0 /100 | #324 | Tragic 22.4% |
| Central American Indians | 0.0 /100 | #325 | Tragic 22.5% |
| Paiute | 0.0 /100 | #326 | Tragic 22.8% |
| Immigrants | Honduras | 0.0 /100 | #327 | Tragic 22.8% |
| Pueblo | 0.0 /100 | #328 | Tragic 23.5% |
| Natives/Alaskans | 0.0 /100 | #329 | Tragic 24.0% |
| Colville | 0.0 /100 | #330 | Tragic 24.1% |
| Dominicans | 0.0 /100 | #331 | Tragic 24.2% |
| Immigrants | Dominican Republic | 0.0 /100 | #332 | Tragic 24.3% |
| Apache | 0.0 /100 | #333 | Tragic 24.5% |
| Blacks/African Americans | 0.0 /100 | #334 | Tragic 24.5% |