Czechoslovakian vs Immigrants from Colombia Poverty
COMPARE
Czechoslovakian
Immigrants from Colombia
Poverty
Poverty Comparison
Czechoslovakians
Immigrants from Colombia
11.4%
POVERTY
95.7/ 100
METRIC RATING
89th/ 347
METRIC RANK
12.3%
POVERTY
47.7/ 100
METRIC RATING
176th/ 347
METRIC RANK
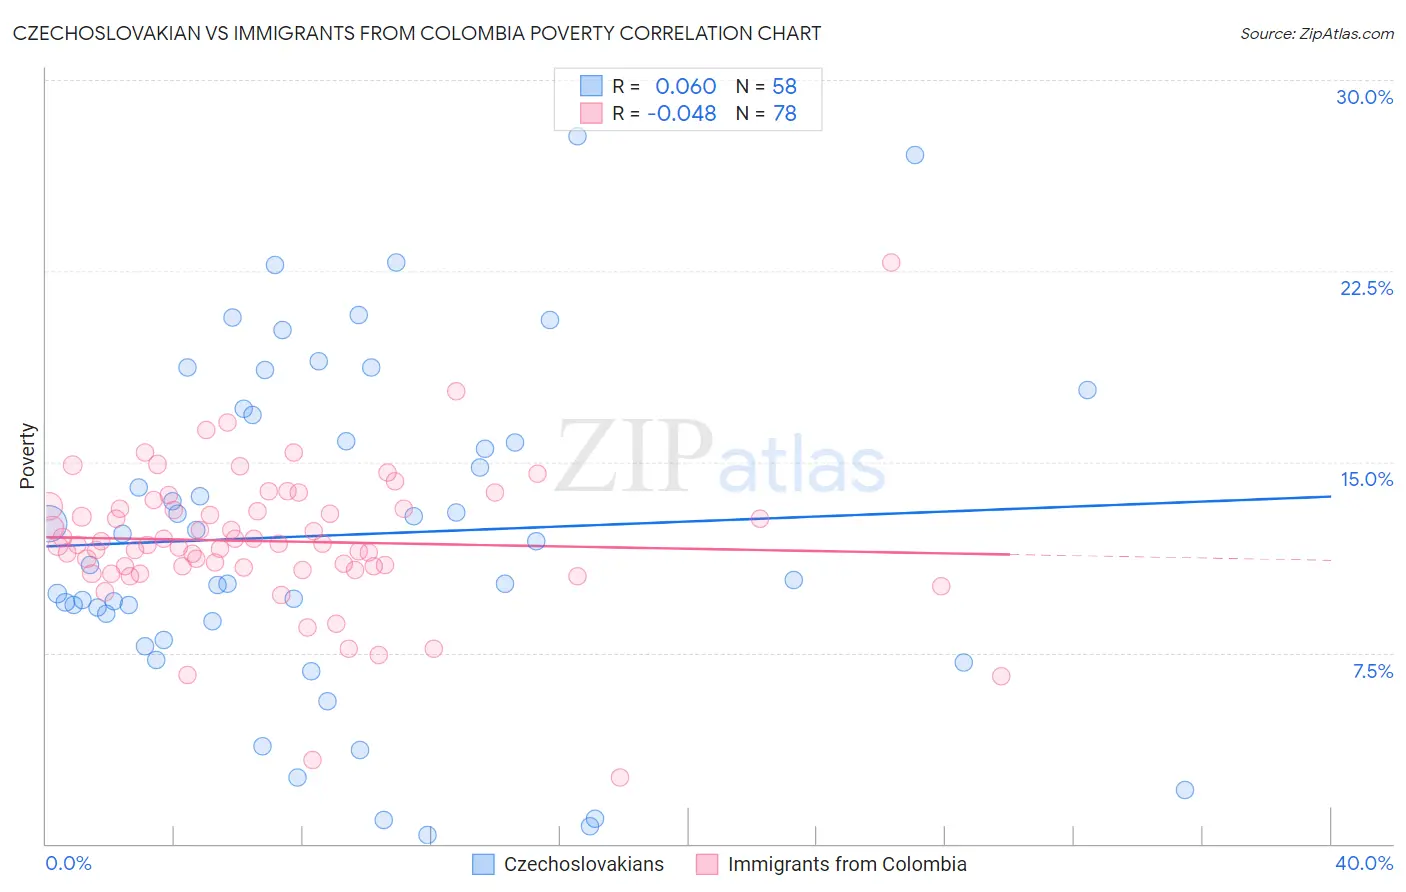
Czechoslovakian vs Immigrants from Colombia Poverty Correlation Chart
The statistical analysis conducted on geographies consisting of 368,518,810 people shows a slight positive correlation between the proportion of Czechoslovakians and poverty level in the United States with a correlation coefficient (R) of 0.060 and weighted average of 11.4%. Similarly, the statistical analysis conducted on geographies consisting of 378,485,502 people shows no correlation between the proportion of Immigrants from Colombia and poverty level in the United States with a correlation coefficient (R) of -0.048 and weighted average of 12.3%, a difference of 8.4%.
Poverty Correlation Summary
| Measurement | Czechoslovakian | Immigrants from Colombia |
| Minimum | 0.33% | 2.6% |
| Maximum | 27.8% | 22.8% |
| Range | 27.5% | 20.2% |
| Mean | 12.1% | 11.9% |
| Median | 11.4% | 11.8% |
| Interquartile 25% (IQ1) | 8.7% | 10.8% |
| Interquartile 75% (IQ3) | 16.8% | 13.2% |
| Interquartile Range (IQR) | 8.1% | 2.3% |
| Standard Deviation (Sample) | 6.5% | 2.8% |
| Standard Deviation (Population) | 6.4% | 2.8% |
Similar Demographics by Poverty
Demographics Similar to Czechoslovakians by Poverty
In terms of poverty, the demographic groups most similar to Czechoslovakians are Belgian (11.4%, a difference of 0.040%), Immigrants from Denmark (11.4%, a difference of 0.17%), Jordanian (11.4%, a difference of 0.18%), Northern European (11.4%, a difference of 0.18%), and Immigrants from England (11.4%, a difference of 0.30%).
| Demographics | Rating | Rank | Poverty |
| Egyptians | 96.5 /100 | #82 | Exceptional 11.3% |
| Immigrants | Sweden | 96.3 /100 | #83 | Exceptional 11.3% |
| English | 96.3 /100 | #84 | Exceptional 11.3% |
| Immigrants | England | 96.2 /100 | #85 | Exceptional 11.4% |
| Jordanians | 96.0 /100 | #86 | Exceptional 11.4% |
| Northern Europeans | 96.0 /100 | #87 | Exceptional 11.4% |
| Belgians | 95.8 /100 | #88 | Exceptional 11.4% |
| Czechoslovakians | 95.7 /100 | #89 | Exceptional 11.4% |
| Immigrants | Denmark | 95.5 /100 | #90 | Exceptional 11.4% |
| Finns | 95.2 /100 | #91 | Exceptional 11.4% |
| British | 95.0 /100 | #92 | Exceptional 11.4% |
| Romanians | 94.9 /100 | #93 | Exceptional 11.4% |
| Paraguayans | 94.9 /100 | #94 | Exceptional 11.4% |
| Australians | 94.9 /100 | #95 | Exceptional 11.4% |
| Immigrants | South Africa | 94.7 /100 | #96 | Exceptional 11.5% |
Demographics Similar to Immigrants from Colombia by Poverty
In terms of poverty, the demographic groups most similar to Immigrants from Colombia are Immigrants from Syria (12.3%, a difference of 0.020%), South American (12.3%, a difference of 0.090%), Lebanese (12.3%, a difference of 0.23%), Celtic (12.3%, a difference of 0.24%), and Immigrants from Portugal (12.3%, a difference of 0.28%).
| Demographics | Rating | Rank | Poverty |
| Whites/Caucasians | 55.4 /100 | #169 | Average 12.3% |
| Immigrants | Oceania | 54.6 /100 | #170 | Average 12.3% |
| Immigrants | Spain | 51.3 /100 | #171 | Average 12.3% |
| Immigrants | Portugal | 50.5 /100 | #172 | Average 12.3% |
| Celtics | 50.1 /100 | #173 | Average 12.3% |
| Lebanese | 50.0 /100 | #174 | Average 12.3% |
| South Americans | 48.7 /100 | #175 | Average 12.3% |
| Immigrants | Colombia | 47.7 /100 | #176 | Average 12.3% |
| Immigrants | Syria | 47.5 /100 | #177 | Average 12.3% |
| Uruguayans | 44.7 /100 | #178 | Average 12.4% |
| Immigrants | Morocco | 44.0 /100 | #179 | Average 12.4% |
| Mongolians | 43.6 /100 | #180 | Average 12.4% |
| Immigrants | Afghanistan | 42.1 /100 | #181 | Average 12.4% |
| Immigrants | Cameroon | 41.7 /100 | #182 | Average 12.4% |
| Immigrants | Iraq | 40.2 /100 | #183 | Average 12.4% |