Arapaho vs Immigrants from Colombia Poverty
COMPARE
Arapaho
Immigrants from Colombia
Poverty
Poverty Comparison
Arapaho
Immigrants from Colombia
16.3%
POVERTY
0.0/ 100
METRIC RATING
321st/ 347
METRIC RANK
12.3%
POVERTY
47.7/ 100
METRIC RATING
176th/ 347
METRIC RANK
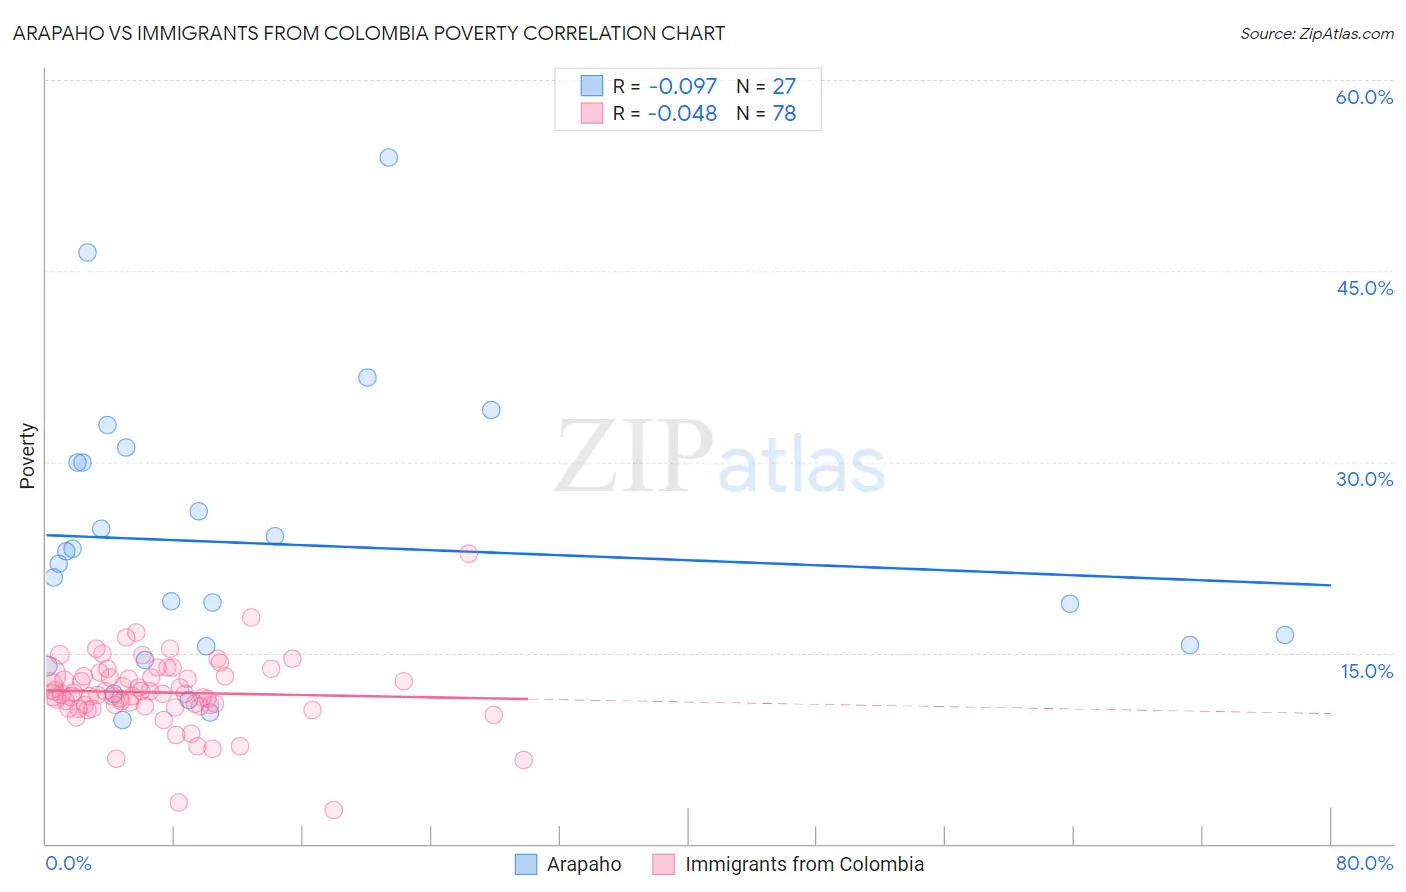
Arapaho vs Immigrants from Colombia Poverty Correlation Chart
The statistical analysis conducted on geographies consisting of 29,778,572 people shows a slight negative correlation between the proportion of Arapaho and poverty level in the United States with a correlation coefficient (R) of -0.097 and weighted average of 16.3%. Similarly, the statistical analysis conducted on geographies consisting of 378,485,502 people shows no correlation between the proportion of Immigrants from Colombia and poverty level in the United States with a correlation coefficient (R) of -0.048 and weighted average of 12.3%, a difference of 31.9%.
Poverty Correlation Summary
| Measurement | Arapaho | Immigrants from Colombia |
| Minimum | 9.8% | 2.6% |
| Maximum | 53.9% | 22.8% |
| Range | 44.2% | 20.2% |
| Mean | 23.5% | 11.9% |
| Median | 22.0% | 11.8% |
| Interquartile 25% (IQ1) | 15.5% | 10.8% |
| Interquartile 75% (IQ3) | 30.0% | 13.2% |
| Interquartile Range (IQR) | 14.4% | 2.3% |
| Standard Deviation (Sample) | 10.8% | 2.8% |
| Standard Deviation (Population) | 10.6% | 2.8% |
Similar Demographics by Poverty
Demographics Similar to Arapaho by Poverty
In terms of poverty, the demographic groups most similar to Arapaho are Immigrants from Honduras (16.2%, a difference of 0.74%), Menominee (16.4%, a difference of 0.96%), Immigrants from Congo (16.1%, a difference of 0.97%), Immigrants from Dominica (16.1%, a difference of 1.2%), and U.S. Virgin Islander (16.1%, a difference of 1.5%).
| Demographics | Rating | Rank | Poverty |
| Immigrants | Somalia | 0.0 /100 | #314 | Tragic 15.8% |
| British West Indians | 0.0 /100 | #315 | Tragic 15.9% |
| Hondurans | 0.0 /100 | #316 | Tragic 15.9% |
| U.S. Virgin Islanders | 0.0 /100 | #317 | Tragic 16.1% |
| Immigrants | Dominica | 0.0 /100 | #318 | Tragic 16.1% |
| Immigrants | Congo | 0.0 /100 | #319 | Tragic 16.1% |
| Immigrants | Honduras | 0.0 /100 | #320 | Tragic 16.2% |
| Arapaho | 0.0 /100 | #321 | Tragic 16.3% |
| Menominee | 0.0 /100 | #322 | Tragic 16.4% |
| Colville | 0.0 /100 | #323 | Tragic 16.6% |
| Yakama | 0.0 /100 | #324 | Tragic 16.7% |
| Central American Indians | 0.0 /100 | #325 | Tragic 16.7% |
| Paiute | 0.0 /100 | #326 | Tragic 16.7% |
| Kiowa | 0.0 /100 | #327 | Tragic 16.8% |
| Ute | 0.0 /100 | #328 | Tragic 16.9% |
Demographics Similar to Immigrants from Colombia by Poverty
In terms of poverty, the demographic groups most similar to Immigrants from Colombia are Immigrants from Syria (12.3%, a difference of 0.020%), South American (12.3%, a difference of 0.090%), Lebanese (12.3%, a difference of 0.23%), Celtic (12.3%, a difference of 0.24%), and Immigrants from Portugal (12.3%, a difference of 0.28%).
| Demographics | Rating | Rank | Poverty |
| Whites/Caucasians | 55.4 /100 | #169 | Average 12.3% |
| Immigrants | Oceania | 54.6 /100 | #170 | Average 12.3% |
| Immigrants | Spain | 51.3 /100 | #171 | Average 12.3% |
| Immigrants | Portugal | 50.5 /100 | #172 | Average 12.3% |
| Celtics | 50.1 /100 | #173 | Average 12.3% |
| Lebanese | 50.0 /100 | #174 | Average 12.3% |
| South Americans | 48.7 /100 | #175 | Average 12.3% |
| Immigrants | Colombia | 47.7 /100 | #176 | Average 12.3% |
| Immigrants | Syria | 47.5 /100 | #177 | Average 12.3% |
| Uruguayans | 44.7 /100 | #178 | Average 12.4% |
| Immigrants | Morocco | 44.0 /100 | #179 | Average 12.4% |
| Mongolians | 43.6 /100 | #180 | Average 12.4% |
| Immigrants | Afghanistan | 42.1 /100 | #181 | Average 12.4% |
| Immigrants | Cameroon | 41.7 /100 | #182 | Average 12.4% |
| Immigrants | Iraq | 40.2 /100 | #183 | Average 12.4% |