Czechoslovakian vs Immigrants from Colombia Disability Age Over 75
COMPARE
Czechoslovakian
Immigrants from Colombia
Disability Age Over 75
Disability Age Over 75 Comparison
Czechoslovakians
Immigrants from Colombia
46.6%
DISABILITY AGE OVER 75
94.7/ 100
METRIC RATING
118th/ 347
METRIC RANK
46.7%
DISABILITY AGE OVER 75
92.6/ 100
METRIC RATING
123rd/ 347
METRIC RANK
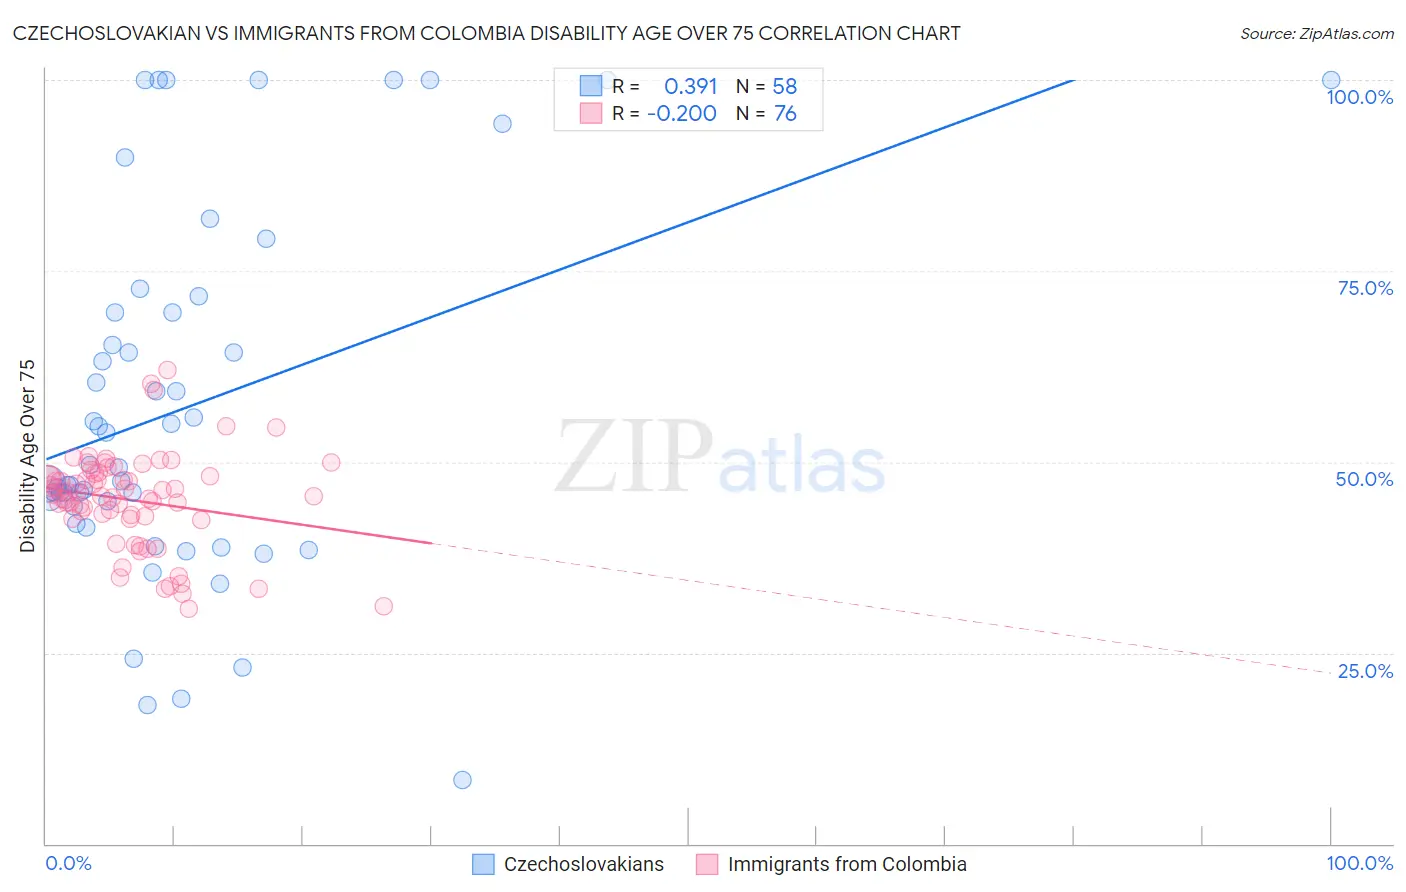
Czechoslovakian vs Immigrants from Colombia Disability Age Over 75 Correlation Chart
The statistical analysis conducted on geographies consisting of 368,266,748 people shows a mild positive correlation between the proportion of Czechoslovakians and percentage of population with a disability over the age of 75 in the United States with a correlation coefficient (R) of 0.391 and weighted average of 46.6%. Similarly, the statistical analysis conducted on geographies consisting of 378,064,071 people shows a poor negative correlation between the proportion of Immigrants from Colombia and percentage of population with a disability over the age of 75 in the United States with a correlation coefficient (R) of -0.200 and weighted average of 46.7%, a difference of 0.20%.
Disability Age Over 75 Correlation Summary
| Measurement | Czechoslovakian | Immigrants from Colombia |
| Minimum | 8.3% | 30.8% |
| Maximum | 100.0% | 62.0% |
| Range | 91.7% | 31.2% |
| Mean | 57.3% | 45.0% |
| Median | 49.4% | 45.6% |
| Interquartile 25% (IQ1) | 44.1% | 42.8% |
| Interquartile 75% (IQ3) | 69.6% | 48.3% |
| Interquartile Range (IQR) | 25.5% | 5.5% |
| Standard Deviation (Sample) | 23.7% | 6.2% |
| Standard Deviation (Population) | 23.5% | 6.2% |
Demographics Similar to Czechoslovakians and Immigrants from Colombia by Disability Age Over 75
In terms of disability age over 75, the demographic groups most similar to Czechoslovakians are Canadian (46.6%, a difference of 0.030%), Immigrants from Nepal (46.6%, a difference of 0.060%), Hungarian (46.5%, a difference of 0.080%), Scandinavian (46.6%, a difference of 0.10%), and Indian (Asian) (46.5%, a difference of 0.13%). Similarly, the demographic groups most similar to Immigrants from Colombia are Immigrants from Albania (46.6%, a difference of 0.050%), Immigrants from South America (46.7%, a difference of 0.060%), Colombian (46.7%, a difference of 0.090%), Scandinavian (46.6%, a difference of 0.10%), and European (46.7%, a difference of 0.10%).
| Demographics | Rating | Rank | Disability Age Over 75 |
| Immigrants | Hong Kong | 96.4 /100 | #110 | Exceptional 46.5% |
| Immigrants | Chile | 96.4 /100 | #111 | Exceptional 46.5% |
| Immigrants | Pakistan | 96.1 /100 | #112 | Exceptional 46.5% |
| Irish | 96.0 /100 | #113 | Exceptional 46.5% |
| Dutch | 95.9 /100 | #114 | Exceptional 46.5% |
| British | 95.7 /100 | #115 | Exceptional 46.5% |
| Indians (Asian) | 95.7 /100 | #116 | Exceptional 46.5% |
| Hungarians | 95.3 /100 | #117 | Exceptional 46.5% |
| Czechoslovakians | 94.7 /100 | #118 | Exceptional 46.6% |
| Canadians | 94.4 /100 | #119 | Exceptional 46.6% |
| Immigrants | Nepal | 94.1 /100 | #120 | Exceptional 46.6% |
| Scandinavians | 93.6 /100 | #121 | Exceptional 46.6% |
| Immigrants | Albania | 93.2 /100 | #122 | Exceptional 46.6% |
| Immigrants | Colombia | 92.6 /100 | #123 | Exceptional 46.7% |
| Immigrants | South America | 91.8 /100 | #124 | Exceptional 46.7% |
| Colombians | 91.3 /100 | #125 | Exceptional 46.7% |
| Europeans | 91.2 /100 | #126 | Exceptional 46.7% |
| Syrians | 91.1 /100 | #127 | Exceptional 46.7% |
| Icelanders | 90.9 /100 | #128 | Exceptional 46.7% |
| Immigrants | Germany | 90.8 /100 | #129 | Exceptional 46.7% |
| Immigrants | Northern Africa | 90.7 /100 | #130 | Exceptional 46.7% |