Cypriot vs Spanish Female Poverty Among 18-24 Year Olds
COMPARE
Cypriot
Spanish
Female Poverty Among 18-24 Year Olds
Female Poverty Among 18-24 Year Olds Comparison
Cypriots
Spanish
19.3%
FEMALE POVERTY AMONG 18-24 YEAR OLDS
95.5/ 100
METRIC RATING
119th/ 347
METRIC RANK
20.6%
FEMALE POVERTY AMONG 18-24 YEAR OLDS
10.4/ 100
METRIC RATING
215th/ 347
METRIC RANK
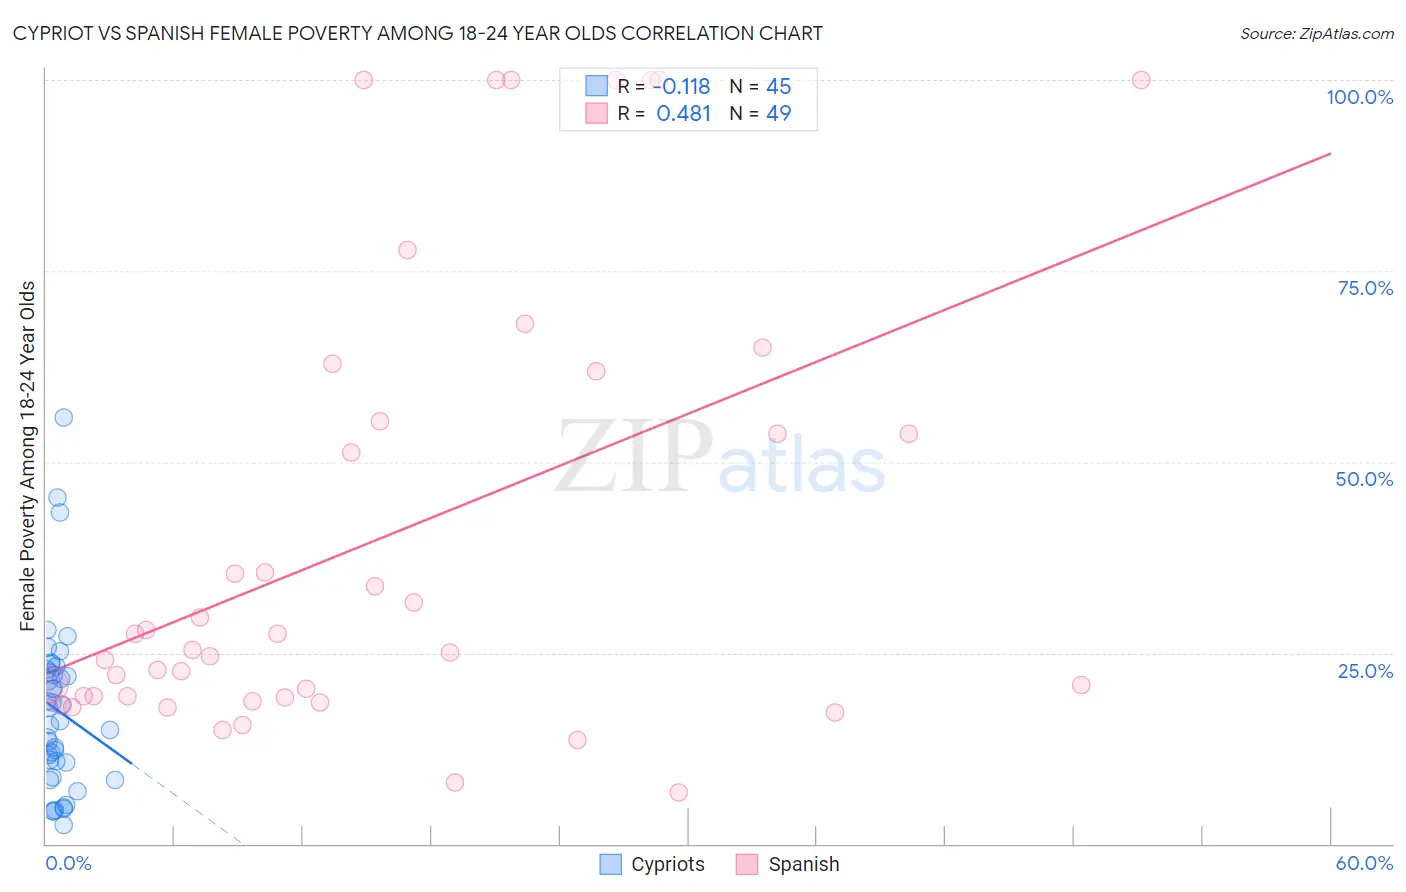
Cypriot vs Spanish Female Poverty Among 18-24 Year Olds Correlation Chart
The statistical analysis conducted on geographies consisting of 61,185,624 people shows a poor negative correlation between the proportion of Cypriots and poverty level among females between the ages 18 and 24 in the United States with a correlation coefficient (R) of -0.118 and weighted average of 19.3%. Similarly, the statistical analysis conducted on geographies consisting of 411,092,173 people shows a moderate positive correlation between the proportion of Spanish and poverty level among females between the ages 18 and 24 in the United States with a correlation coefficient (R) of 0.481 and weighted average of 20.6%, a difference of 6.6%.
Female Poverty Among 18-24 Year Olds Correlation Summary
| Measurement | Cypriot | Spanish |
| Minimum | 2.5% | 6.7% |
| Maximum | 55.9% | 100.0% |
| Range | 53.4% | 93.3% |
| Mean | 17.4% | 40.2% |
| Median | 16.0% | 25.3% |
| Interquartile 25% (IQ1) | 9.7% | 19.2% |
| Interquartile 75% (IQ3) | 22.6% | 58.6% |
| Interquartile Range (IQR) | 12.9% | 39.4% |
| Standard Deviation (Sample) | 11.1% | 29.6% |
| Standard Deviation (Population) | 10.9% | 29.3% |
Similar Demographics by Female Poverty Among 18-24 Year Olds
Demographics Similar to Cypriots by Female Poverty Among 18-24 Year Olds
In terms of female poverty among 18-24 year olds, the demographic groups most similar to Cypriots are Immigrants from Guyana (19.3%, a difference of 0.020%), Immigrants from Northern Europe (19.4%, a difference of 0.040%), Immigrants from Iran (19.3%, a difference of 0.070%), Guyanese (19.4%, a difference of 0.070%), and Immigrants (19.3%, a difference of 0.11%).
| Demographics | Rating | Rank | Female Poverty Among 18-24 Year Olds |
| Immigrants | El Salvador | 96.5 /100 | #112 | Exceptional 19.3% |
| Immigrants | Cameroon | 96.3 /100 | #113 | Exceptional 19.3% |
| Slovenes | 96.2 /100 | #114 | Exceptional 19.3% |
| Immigrants | Hungary | 96.2 /100 | #115 | Exceptional 19.3% |
| Immigrants | Immigrants | 95.9 /100 | #116 | Exceptional 19.3% |
| Immigrants | Iran | 95.8 /100 | #117 | Exceptional 19.3% |
| Immigrants | Guyana | 95.6 /100 | #118 | Exceptional 19.3% |
| Cypriots | 95.5 /100 | #119 | Exceptional 19.3% |
| Immigrants | Northern Europe | 95.4 /100 | #120 | Exceptional 19.4% |
| Guyanese | 95.3 /100 | #121 | Exceptional 19.4% |
| Cambodians | 94.6 /100 | #122 | Exceptional 19.4% |
| Paraguayans | 94.6 /100 | #123 | Exceptional 19.4% |
| Immigrants | Chile | 94.3 /100 | #124 | Exceptional 19.4% |
| Immigrants | Panama | 94.0 /100 | #125 | Exceptional 19.4% |
| Immigrants | Russia | 93.7 /100 | #126 | Exceptional 19.4% |
Demographics Similar to Spanish by Female Poverty Among 18-24 Year Olds
In terms of female poverty among 18-24 year olds, the demographic groups most similar to Spanish are Immigrants from Western Africa (20.6%, a difference of 0.020%), Immigrants from South Africa (20.6%, a difference of 0.040%), Immigrants from Laos (20.6%, a difference of 0.090%), Immigrants from Nepal (20.7%, a difference of 0.10%), and Immigrants from Micronesia (20.7%, a difference of 0.11%).
| Demographics | Rating | Rank | Female Poverty Among 18-24 Year Olds |
| Dutch | 15.9 /100 | #208 | Poor 20.5% |
| Arabs | 15.5 /100 | #209 | Poor 20.5% |
| Immigrants | Ghana | 14.3 /100 | #210 | Poor 20.5% |
| Immigrants | Western Europe | 13.5 /100 | #211 | Poor 20.6% |
| Liberians | 11.6 /100 | #212 | Poor 20.6% |
| Northern Europeans | 11.6 /100 | #213 | Poor 20.6% |
| Immigrants | South Africa | 10.7 /100 | #214 | Poor 20.6% |
| Spanish | 10.4 /100 | #215 | Poor 20.6% |
| Immigrants | Western Africa | 10.2 /100 | #216 | Poor 20.6% |
| Immigrants | Laos | 9.7 /100 | #217 | Tragic 20.6% |
| Immigrants | Nepal | 9.6 /100 | #218 | Tragic 20.7% |
| Immigrants | Micronesia | 9.6 /100 | #219 | Tragic 20.7% |
| British | 9.4 /100 | #220 | Tragic 20.7% |
| Barbadians | 9.0 /100 | #221 | Tragic 20.7% |
| Guatemalans | 8.1 /100 | #222 | Tragic 20.7% |