Aleut vs Colombian Child Poverty Under the Age of 5
COMPARE
Aleut
Colombian
Child Poverty Under the Age of 5
Child Poverty Under the Age of 5 Comparison
Aleuts
Colombians
20.3%
CHILD POVERTY UNDER THE AGE OF 5
0.1/ 100
METRIC RATING
266th/ 347
METRIC RANK
16.7%
CHILD POVERTY UNDER THE AGE OF 5
77.8/ 100
METRIC RATING
150th/ 347
METRIC RANK
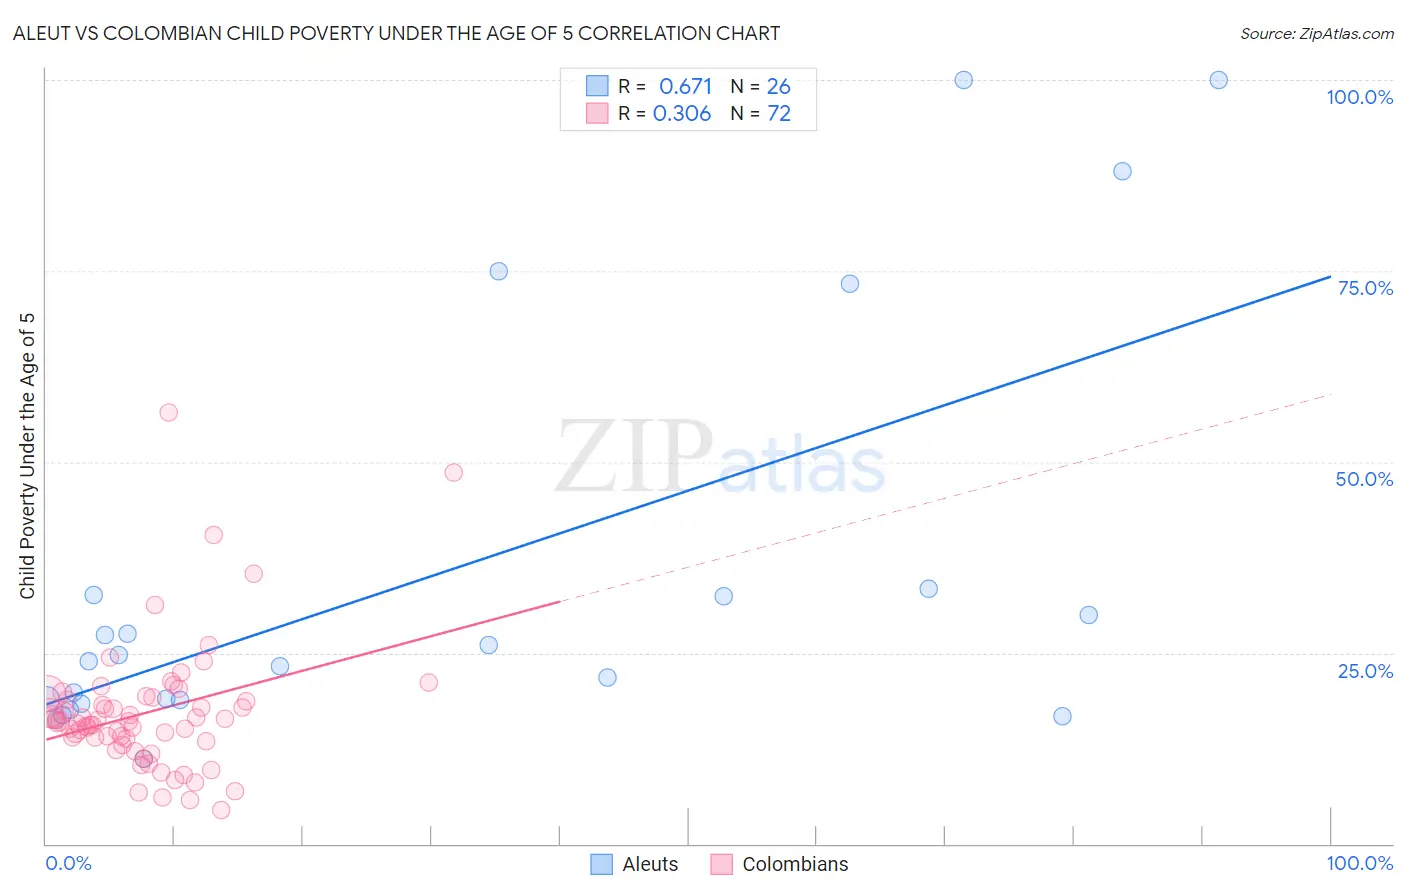
Aleut vs Colombian Child Poverty Under the Age of 5 Correlation Chart
The statistical analysis conducted on geographies consisting of 61,069,429 people shows a significant positive correlation between the proportion of Aleuts and poverty level among children under the age of 5 in the United States with a correlation coefficient (R) of 0.671 and weighted average of 20.3%. Similarly, the statistical analysis conducted on geographies consisting of 402,400,688 people shows a mild positive correlation between the proportion of Colombians and poverty level among children under the age of 5 in the United States with a correlation coefficient (R) of 0.306 and weighted average of 16.7%, a difference of 21.5%.
Child Poverty Under the Age of 5 Correlation Summary
| Measurement | Aleut | Colombian |
| Minimum | 11.1% | 4.4% |
| Maximum | 100.0% | 56.5% |
| Range | 88.9% | 52.0% |
| Mean | 35.1% | 17.1% |
| Median | 24.3% | 15.9% |
| Interquartile 25% (IQ1) | 18.8% | 13.6% |
| Interquartile 75% (IQ3) | 32.6% | 19.1% |
| Interquartile Range (IQR) | 13.9% | 5.4% |
| Standard Deviation (Sample) | 27.1% | 8.6% |
| Standard Deviation (Population) | 26.5% | 8.5% |
Similar Demographics by Child Poverty Under the Age of 5
Demographics Similar to Aleuts by Child Poverty Under the Age of 5
In terms of child poverty under the age of 5, the demographic groups most similar to Aleuts are Spanish American Indian (20.2%, a difference of 0.13%), Immigrants from Liberia (20.2%, a difference of 0.24%), Barbadian (20.2%, a difference of 0.37%), Ottawa (20.3%, a difference of 0.39%), and Belizean (20.3%, a difference of 0.40%).
| Demographics | Rating | Rank | Child Poverty Under the Age of 5 |
| Immigrants | El Salvador | 0.2 /100 | #259 | Tragic 20.0% |
| Spanish Americans | 0.2 /100 | #260 | Tragic 20.1% |
| Immigrants | Bangladesh | 0.2 /100 | #261 | Tragic 20.1% |
| Liberians | 0.1 /100 | #262 | Tragic 20.2% |
| Barbadians | 0.1 /100 | #263 | Tragic 20.2% |
| Immigrants | Liberia | 0.1 /100 | #264 | Tragic 20.2% |
| Spanish American Indians | 0.1 /100 | #265 | Tragic 20.2% |
| Aleuts | 0.1 /100 | #266 | Tragic 20.3% |
| Ottawa | 0.1 /100 | #267 | Tragic 20.3% |
| Belizeans | 0.1 /100 | #268 | Tragic 20.3% |
| Immigrants | Burma/Myanmar | 0.1 /100 | #269 | Tragic 20.4% |
| Jamaicans | 0.1 /100 | #270 | Tragic 20.4% |
| Americans | 0.1 /100 | #271 | Tragic 20.5% |
| Immigrants | Jamaica | 0.1 /100 | #272 | Tragic 20.5% |
| Central Americans | 0.1 /100 | #273 | Tragic 20.6% |
Demographics Similar to Colombians by Child Poverty Under the Age of 5
In terms of child poverty under the age of 5, the demographic groups most similar to Colombians are Canadian (16.7%, a difference of 0.030%), Belgian (16.7%, a difference of 0.10%), Dutch (16.7%, a difference of 0.11%), New Zealander (16.6%, a difference of 0.14%), and Syrian (16.6%, a difference of 0.20%).
| Demographics | Rating | Rank | Child Poverty Under the Age of 5 |
| Samoans | 83.0 /100 | #143 | Excellent 16.5% |
| Ethiopians | 82.7 /100 | #144 | Excellent 16.5% |
| Immigrants | Ethiopia | 82.1 /100 | #145 | Excellent 16.6% |
| Israelis | 82.0 /100 | #146 | Excellent 16.6% |
| Immigrants | Nepal | 80.3 /100 | #147 | Excellent 16.6% |
| Syrians | 79.1 /100 | #148 | Good 16.6% |
| New Zealanders | 78.7 /100 | #149 | Good 16.6% |
| Colombians | 77.8 /100 | #150 | Good 16.7% |
| Canadians | 77.6 /100 | #151 | Good 16.7% |
| Belgians | 77.2 /100 | #152 | Good 16.7% |
| Dutch | 77.1 /100 | #153 | Good 16.7% |
| Immigrants | Venezuela | 76.0 /100 | #154 | Good 16.7% |
| South Americans | 75.1 /100 | #155 | Good 16.7% |
| Afghans | 74.4 /100 | #156 | Good 16.8% |
| Venezuelans | 73.7 /100 | #157 | Good 16.8% |