Tsimshian vs Immigrants from Serbia Female Poverty Among 18-24 Year Olds
COMPARE
Tsimshian
Immigrants from Serbia
Female Poverty Among 18-24 Year Olds
Female Poverty Among 18-24 Year Olds Comparison
Tsimshian
Immigrants from Serbia
21.2%
FEMALE POVERTY AMONG 18-24 YEAR OLDS
1.0/ 100
METRIC RATING
256th/ 347
METRIC RANK
19.2%
FEMALE POVERTY AMONG 18-24 YEAR OLDS
97.1/ 100
METRIC RATING
111th/ 347
METRIC RANK
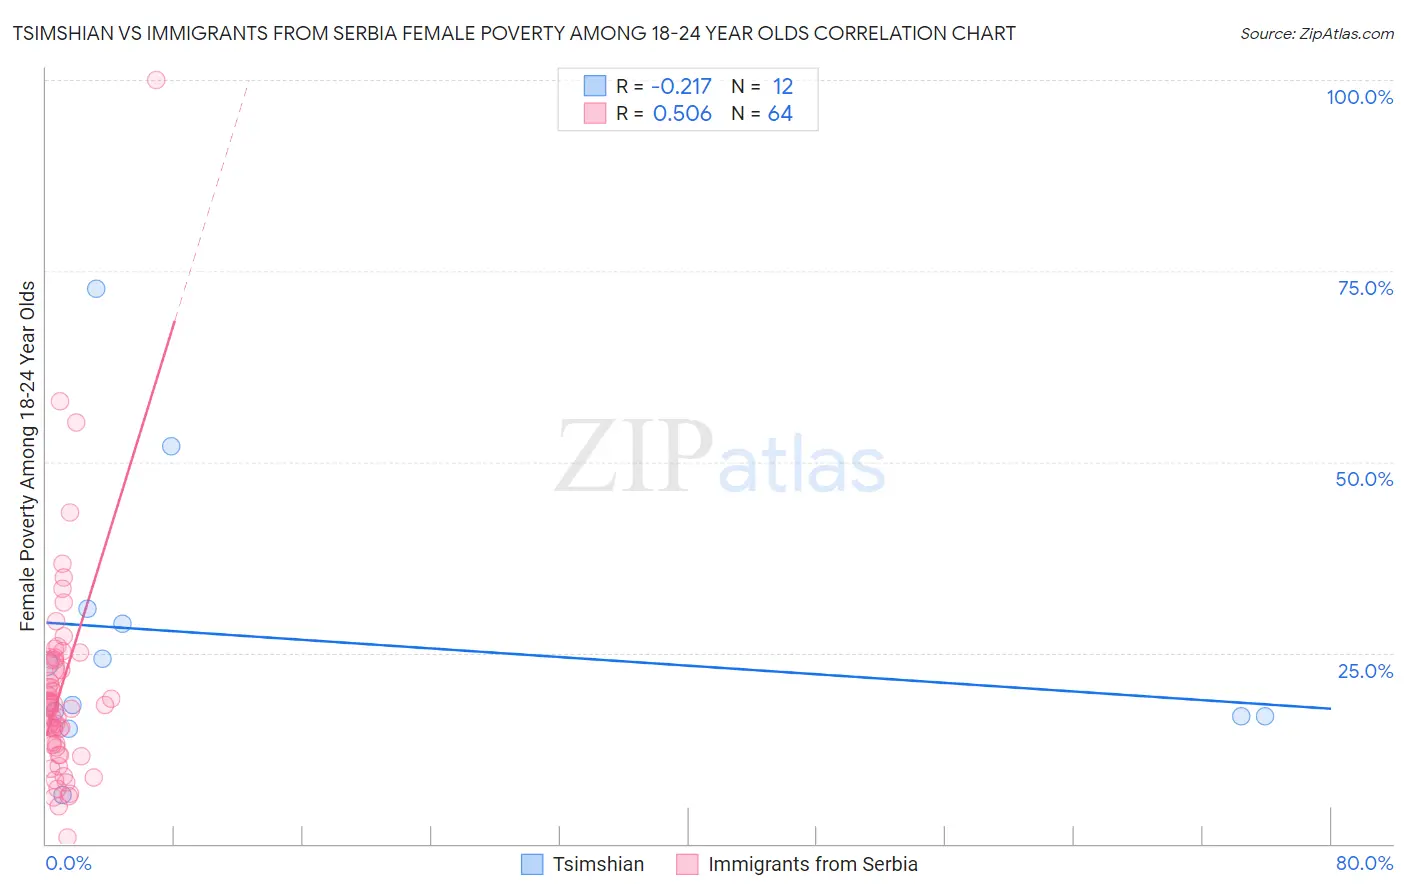
Tsimshian vs Immigrants from Serbia Female Poverty Among 18-24 Year Olds Correlation Chart
The statistical analysis conducted on geographies consisting of 15,547,033 people shows a weak negative correlation between the proportion of Tsimshian and poverty level among females between the ages 18 and 24 in the United States with a correlation coefficient (R) of -0.217 and weighted average of 21.2%. Similarly, the statistical analysis conducted on geographies consisting of 130,475,309 people shows a substantial positive correlation between the proportion of Immigrants from Serbia and poverty level among females between the ages 18 and 24 in the United States with a correlation coefficient (R) of 0.506 and weighted average of 19.2%, a difference of 10.3%.
Female Poverty Among 18-24 Year Olds Correlation Summary
| Measurement | Tsimshian | Immigrants from Serbia |
| Minimum | 6.4% | 0.90% |
| Maximum | 72.7% | 100.0% |
| Range | 66.4% | 99.1% |
| Mean | 26.9% | 20.4% |
| Median | 20.9% | 18.2% |
| Interquartile 25% (IQ1) | 16.7% | 12.8% |
| Interquartile 75% (IQ3) | 29.8% | 24.0% |
| Interquartile Range (IQR) | 13.2% | 11.2% |
| Standard Deviation (Sample) | 18.4% | 14.6% |
| Standard Deviation (Population) | 17.6% | 14.5% |
Similar Demographics by Female Poverty Among 18-24 Year Olds
Demographics Similar to Tsimshian by Female Poverty Among 18-24 Year Olds
In terms of female poverty among 18-24 year olds, the demographic groups most similar to Tsimshian are Taiwanese (21.2%, a difference of 0.10%), Immigrants from Grenada (21.2%, a difference of 0.15%), British West Indian (21.2%, a difference of 0.18%), Delaware (21.1%, a difference of 0.47%), and South African (21.1%, a difference of 0.52%).
| Demographics | Rating | Rank | Female Poverty Among 18-24 Year Olds |
| Carpatho Rusyns | 2.5 /100 | #249 | Tragic 21.0% |
| Immigrants | West Indies | 2.2 /100 | #250 | Tragic 21.0% |
| West Indians | 1.9 /100 | #251 | Tragic 21.1% |
| South Africans | 1.6 /100 | #252 | Tragic 21.1% |
| Delaware | 1.6 /100 | #253 | Tragic 21.1% |
| British West Indians | 1.2 /100 | #254 | Tragic 21.2% |
| Immigrants | Grenada | 1.2 /100 | #255 | Tragic 21.2% |
| Tsimshian | 1.0 /100 | #256 | Tragic 21.2% |
| Taiwanese | 1.0 /100 | #257 | Tragic 21.2% |
| Vietnamese | 0.6 /100 | #258 | Tragic 21.4% |
| Immigrants | France | 0.6 /100 | #259 | Tragic 21.4% |
| Immigrants | Norway | 0.6 /100 | #260 | Tragic 21.4% |
| Immigrants | Bahamas | 0.5 /100 | #261 | Tragic 21.4% |
| Immigrants | Eastern Africa | 0.4 /100 | #262 | Tragic 21.4% |
| Icelanders | 0.3 /100 | #263 | Tragic 21.5% |
Demographics Similar to Immigrants from Serbia by Female Poverty Among 18-24 Year Olds
In terms of female poverty among 18-24 year olds, the demographic groups most similar to Immigrants from Serbia are Laotian (19.2%, a difference of 0.020%), Immigrants from Syria (19.2%, a difference of 0.040%), Immigrants from Uzbekistan (19.2%, a difference of 0.12%), Immigrants from Sri Lanka (19.2%, a difference of 0.22%), and Immigrants from El Salvador (19.3%, a difference of 0.23%).
| Demographics | Rating | Rank | Female Poverty Among 18-24 Year Olds |
| Immigrants | Afghanistan | 98.0 /100 | #104 | Exceptional 19.1% |
| Immigrants | Ecuador | 97.8 /100 | #105 | Exceptional 19.2% |
| Immigrants | Sierra Leone | 97.8 /100 | #106 | Exceptional 19.2% |
| Immigrants | Sri Lanka | 97.5 /100 | #107 | Exceptional 19.2% |
| Immigrants | Uzbekistan | 97.3 /100 | #108 | Exceptional 19.2% |
| Immigrants | Syria | 97.2 /100 | #109 | Exceptional 19.2% |
| Laotians | 97.1 /100 | #110 | Exceptional 19.2% |
| Immigrants | Serbia | 97.1 /100 | #111 | Exceptional 19.2% |
| Immigrants | El Salvador | 96.5 /100 | #112 | Exceptional 19.3% |
| Immigrants | Cameroon | 96.3 /100 | #113 | Exceptional 19.3% |
| Slovenes | 96.2 /100 | #114 | Exceptional 19.3% |
| Immigrants | Hungary | 96.2 /100 | #115 | Exceptional 19.3% |
| Immigrants | Immigrants | 95.9 /100 | #116 | Exceptional 19.3% |
| Immigrants | Iran | 95.8 /100 | #117 | Exceptional 19.3% |
| Immigrants | Guyana | 95.6 /100 | #118 | Exceptional 19.3% |