Crow vs Immigrants from Eritrea Self-Care Disability
COMPARE
Crow
Immigrants from Eritrea
Self-Care Disability
Self-Care Disability Comparison
Crow
Immigrants from Eritrea
2.5%
SELF-CARE DISABILITY
15.2/ 100
METRIC RATING
197th/ 347
METRIC RANK
2.2%
SELF-CARE DISABILITY
100.0/ 100
METRIC RATING
19th/ 347
METRIC RANK
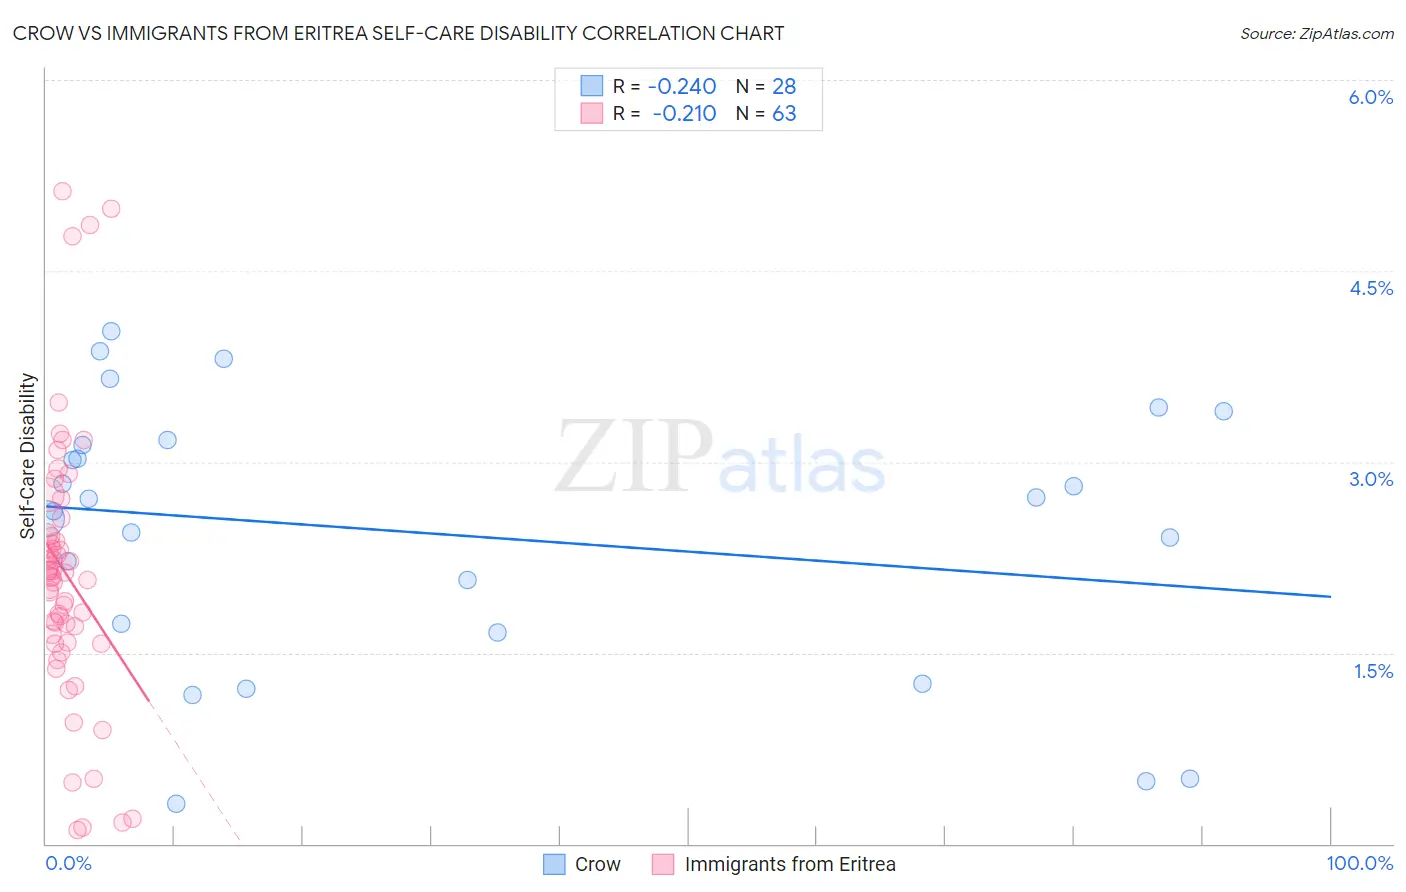
Crow vs Immigrants from Eritrea Self-Care Disability Correlation Chart
The statistical analysis conducted on geographies consisting of 59,179,234 people shows a weak negative correlation between the proportion of Crow and percentage of population with self-care disability in the United States with a correlation coefficient (R) of -0.240 and weighted average of 2.5%. Similarly, the statistical analysis conducted on geographies consisting of 104,840,277 people shows a weak negative correlation between the proportion of Immigrants from Eritrea and percentage of population with self-care disability in the United States with a correlation coefficient (R) of -0.210 and weighted average of 2.2%, a difference of 13.3%.
Self-Care Disability Correlation Summary
| Measurement | Crow | Immigrants from Eritrea |
| Minimum | 0.32% | 0.11% |
| Maximum | 4.0% | 5.1% |
| Range | 3.7% | 5.0% |
| Mean | 2.4% | 2.1% |
| Median | 2.7% | 2.1% |
| Interquartile 25% (IQ1) | 1.7% | 1.6% |
| Interquartile 75% (IQ3) | 3.2% | 2.4% |
| Interquartile Range (IQR) | 1.5% | 0.85% |
| Standard Deviation (Sample) | 1.1% | 1.1% |
| Standard Deviation (Population) | 1.0% | 1.1% |
Similar Demographics by Self-Care Disability
Demographics Similar to Crow by Self-Care Disability
In terms of self-care disability, the demographic groups most similar to Crow are Immigrants (2.5%, a difference of 0.020%), Immigrants from Southern Europe (2.5%, a difference of 0.030%), Korean (2.5%, a difference of 0.030%), Immigrants from Ghana (2.5%, a difference of 0.050%), and Immigrants from Western Africa (2.5%, a difference of 0.19%).
| Demographics | Rating | Rank | Self-Care Disability |
| Sioux | 24.6 /100 | #190 | Fair 2.5% |
| Moroccans | 22.9 /100 | #191 | Fair 2.5% |
| Soviet Union | 22.2 /100 | #192 | Fair 2.5% |
| Ukrainians | 21.4 /100 | #193 | Fair 2.5% |
| Immigrants | Germany | 17.9 /100 | #194 | Poor 2.5% |
| Immigrants | Southern Europe | 15.6 /100 | #195 | Poor 2.5% |
| Koreans | 15.5 /100 | #196 | Poor 2.5% |
| Crow | 15.2 /100 | #197 | Poor 2.5% |
| Immigrants | Immigrants | 15.0 /100 | #198 | Poor 2.5% |
| Immigrants | Ghana | 14.7 /100 | #199 | Poor 2.5% |
| Immigrants | Western Africa | 13.3 /100 | #200 | Poor 2.5% |
| Immigrants | South Eastern Asia | 12.9 /100 | #201 | Poor 2.5% |
| Slovaks | 12.6 /100 | #202 | Poor 2.5% |
| Immigrants | Lebanon | 12.4 /100 | #203 | Poor 2.5% |
| Immigrants | Bahamas | 11.9 /100 | #204 | Poor 2.5% |
Demographics Similar to Immigrants from Eritrea by Self-Care Disability
In terms of self-care disability, the demographic groups most similar to Immigrants from Eritrea are Tongan (2.2%, a difference of 0.080%), Immigrants from Taiwan (2.2%, a difference of 0.33%), Bulgarian (2.2%, a difference of 0.33%), Immigrants from Venezuela (2.2%, a difference of 0.36%), and Cambodian (2.2%, a difference of 0.58%).
| Demographics | Rating | Rank | Self-Care Disability |
| Immigrants | Ethiopia | 100.0 /100 | #12 | Exceptional 2.2% |
| Ethiopians | 100.0 /100 | #13 | Exceptional 2.2% |
| Luxembourgers | 100.0 /100 | #14 | Exceptional 2.2% |
| Okinawans | 100.0 /100 | #15 | Exceptional 2.2% |
| Immigrants | Kuwait | 100.0 /100 | #16 | Exceptional 2.2% |
| Immigrants | Saudi Arabia | 100.0 /100 | #17 | Exceptional 2.2% |
| Immigrants | Taiwan | 100.0 /100 | #18 | Exceptional 2.2% |
| Immigrants | Eritrea | 100.0 /100 | #19 | Exceptional 2.2% |
| Tongans | 100.0 /100 | #20 | Exceptional 2.2% |
| Bulgarians | 100.0 /100 | #21 | Exceptional 2.2% |
| Immigrants | Venezuela | 100.0 /100 | #22 | Exceptional 2.2% |
| Cambodians | 100.0 /100 | #23 | Exceptional 2.2% |
| Cypriots | 100.0 /100 | #24 | Exceptional 2.2% |
| Turks | 100.0 /100 | #25 | Exceptional 2.2% |
| Immigrants | Sri Lanka | 99.9 /100 | #26 | Exceptional 2.2% |