Croatian vs Chilean Single Father Poverty
COMPARE
Croatian
Chilean
Single Father Poverty
Single Father Poverty Comparison
Croatians
Chileans
17.1%
SINGLE FATHER POVERTY
1.0/ 100
METRIC RATING
252nd/ 347
METRIC RANK
15.7%
SINGLE FATHER POVERTY
96.4/ 100
METRIC RATING
102nd/ 347
METRIC RANK
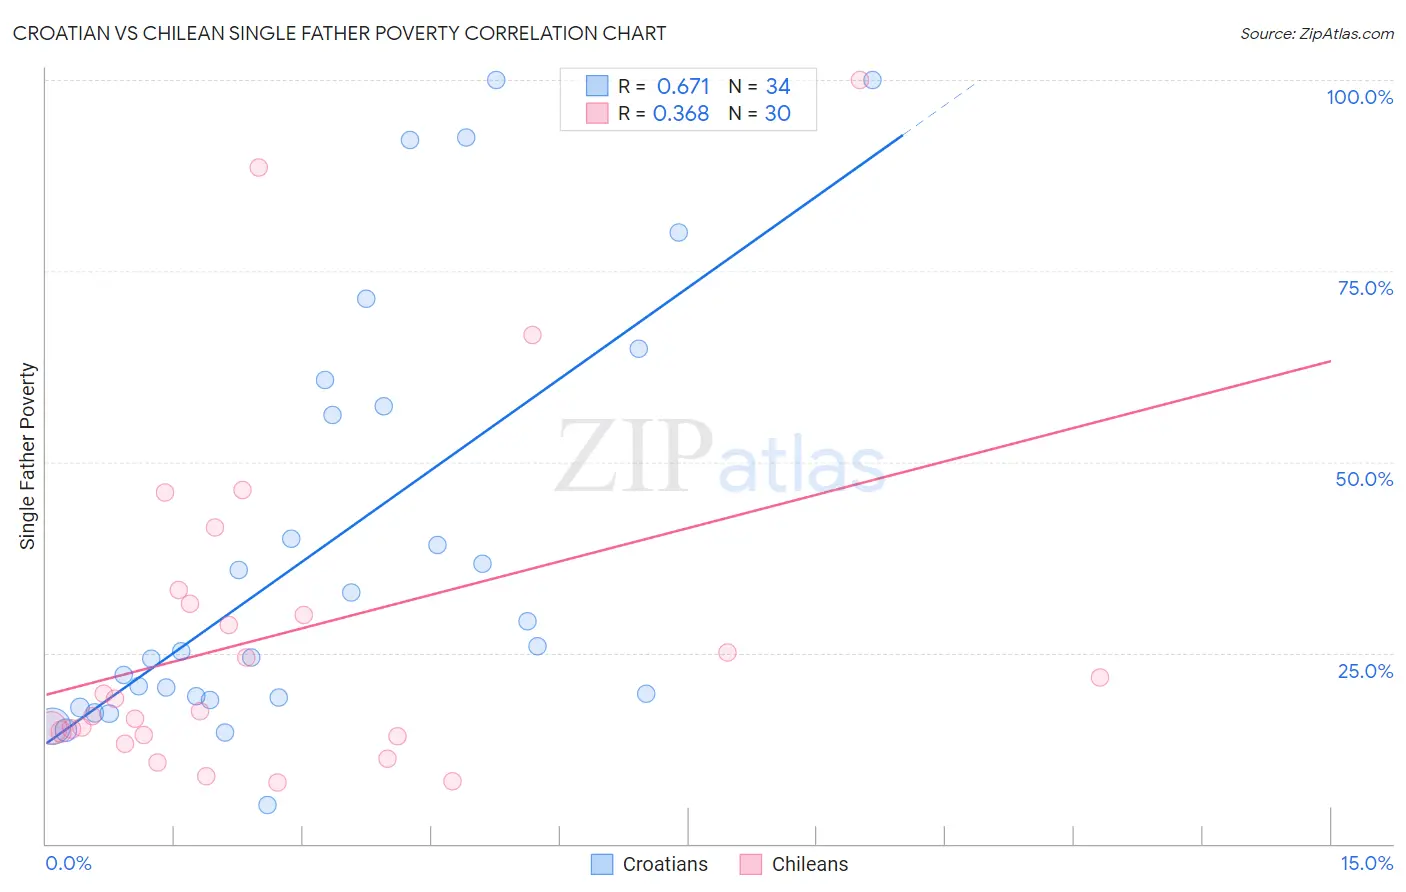
Croatian vs Chilean Single Father Poverty Correlation Chart
The statistical analysis conducted on geographies consisting of 290,349,710 people shows a significant positive correlation between the proportion of Croatians and poverty level among single fathers in the United States with a correlation coefficient (R) of 0.671 and weighted average of 17.1%. Similarly, the statistical analysis conducted on geographies consisting of 214,217,238 people shows a mild positive correlation between the proportion of Chileans and poverty level among single fathers in the United States with a correlation coefficient (R) of 0.368 and weighted average of 15.7%, a difference of 9.0%.
Single Father Poverty Correlation Summary
| Measurement | Croatian | Chilean |
| Minimum | 5.0% | 8.0% |
| Maximum | 100.0% | 100.0% |
| Range | 95.0% | 92.0% |
| Mean | 39.1% | 27.3% |
| Median | 25.6% | 18.2% |
| Interquartile 25% (IQ1) | 19.1% | 14.2% |
| Interquartile 75% (IQ3) | 57.3% | 31.4% |
| Interquartile Range (IQR) | 38.2% | 17.2% |
| Standard Deviation (Sample) | 27.7% | 22.6% |
| Standard Deviation (Population) | 27.3% | 22.2% |
Similar Demographics by Single Father Poverty
Demographics Similar to Croatians by Single Father Poverty
In terms of single father poverty, the demographic groups most similar to Croatians are Cree (17.1%, a difference of 0.010%), Luxembourger (17.1%, a difference of 0.10%), Austrian (17.1%, a difference of 0.11%), Immigrants from Honduras (17.1%, a difference of 0.12%), and Canadian (17.1%, a difference of 0.24%).
| Demographics | Rating | Rank | Single Father Poverty |
| Trinidadians and Tobagonians | 1.5 /100 | #245 | Tragic 17.0% |
| Immigrants | Ireland | 1.4 /100 | #246 | Tragic 17.1% |
| Greeks | 1.3 /100 | #247 | Tragic 17.1% |
| Czechoslovakians | 1.3 /100 | #248 | Tragic 17.1% |
| Canadians | 1.3 /100 | #249 | Tragic 17.1% |
| Austrians | 1.1 /100 | #250 | Tragic 17.1% |
| Luxembourgers | 1.1 /100 | #251 | Tragic 17.1% |
| Croatians | 1.0 /100 | #252 | Tragic 17.1% |
| Cree | 1.0 /100 | #253 | Tragic 17.1% |
| Immigrants | Honduras | 0.9 /100 | #254 | Tragic 17.1% |
| Sierra Leoneans | 0.8 /100 | #255 | Tragic 17.2% |
| Immigrants | Haiti | 0.8 /100 | #256 | Tragic 17.2% |
| Immigrants | Albania | 0.7 /100 | #257 | Tragic 17.2% |
| Albanians | 0.7 /100 | #258 | Tragic 17.2% |
| Immigrants | Jamaica | 0.7 /100 | #259 | Tragic 17.2% |
Demographics Similar to Chileans by Single Father Poverty
In terms of single father poverty, the demographic groups most similar to Chileans are South American Indian (15.7%, a difference of 0.060%), Australian (15.7%, a difference of 0.080%), Immigrants from Australia (15.7%, a difference of 0.10%), Fijian (15.7%, a difference of 0.16%), and Immigrants from Poland (15.7%, a difference of 0.17%).
| Demographics | Rating | Rank | Single Father Poverty |
| Immigrants | Kazakhstan | 98.2 /100 | #95 | Exceptional 15.6% |
| Immigrants | Belgium | 98.1 /100 | #96 | Exceptional 15.6% |
| Yaqui | 98.1 /100 | #97 | Exceptional 15.6% |
| Zimbabweans | 98.1 /100 | #98 | Exceptional 15.6% |
| Immigrants | Middle Africa | 97.4 /100 | #99 | Exceptional 15.6% |
| Immigrants | Chile | 96.9 /100 | #100 | Exceptional 15.7% |
| Fijians | 96.8 /100 | #101 | Exceptional 15.7% |
| Chileans | 96.4 /100 | #102 | Exceptional 15.7% |
| South American Indians | 96.2 /100 | #103 | Exceptional 15.7% |
| Australians | 96.1 /100 | #104 | Exceptional 15.7% |
| Immigrants | Australia | 96.1 /100 | #105 | Exceptional 15.7% |
| Immigrants | Poland | 95.8 /100 | #106 | Exceptional 15.7% |
| Native Hawaiians | 95.8 /100 | #107 | Exceptional 15.7% |
| Pakistanis | 95.7 /100 | #108 | Exceptional 15.7% |
| Turks | 95.1 /100 | #109 | Exceptional 15.8% |