Croatian vs Indonesian 8th Grade
COMPARE
Croatian
Indonesian
8th Grade
8th Grade Comparison
Croatians
Indonesians
97.2%
8TH GRADE
100.0/ 100
METRIC RATING
20th/ 347
METRIC RANK
94.1%
8TH GRADE
0.0/ 100
METRIC RATING
298th/ 347
METRIC RANK
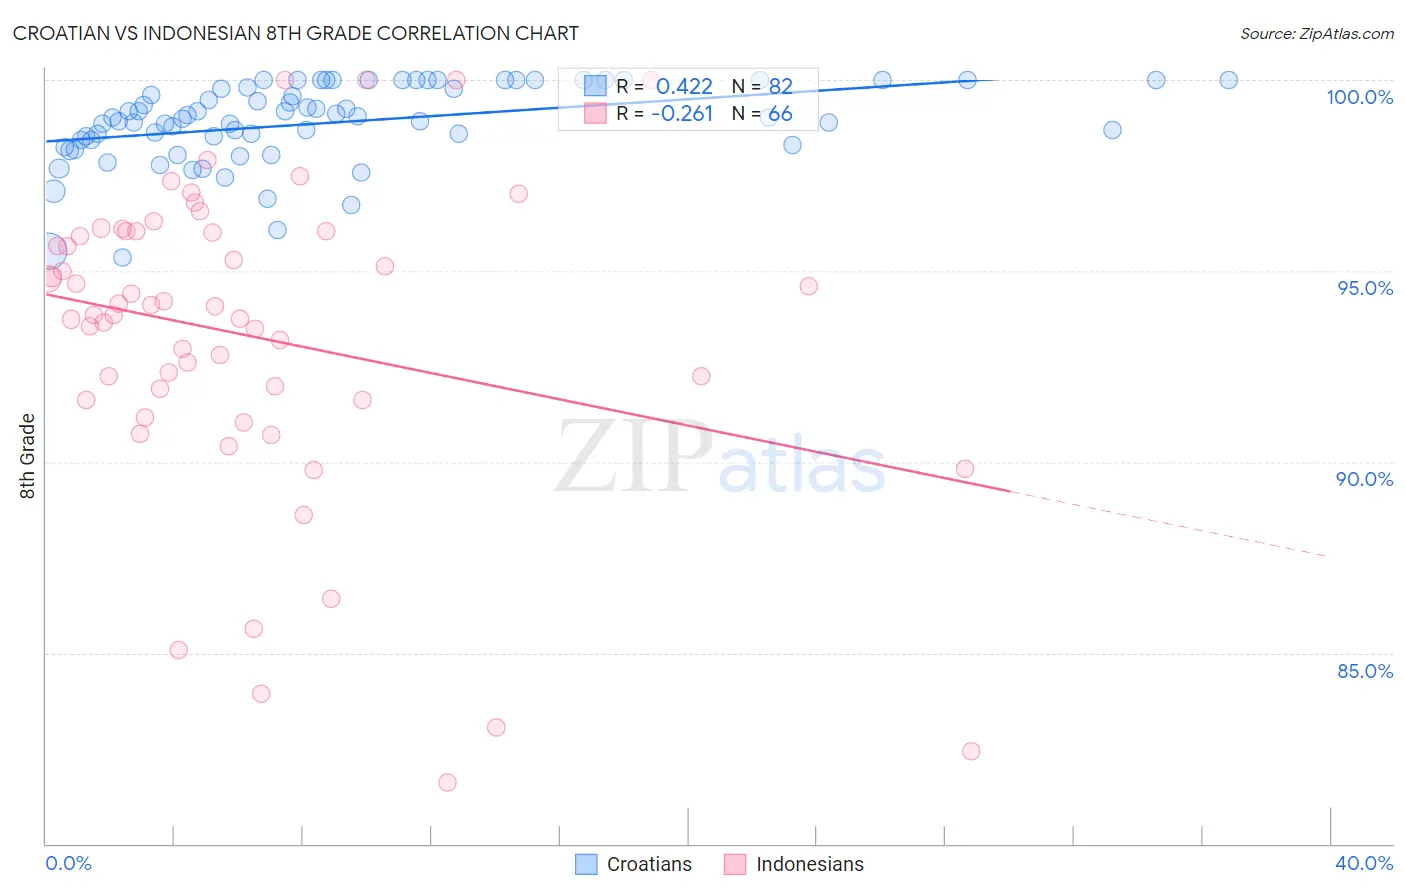
Croatian vs Indonesian 8th Grade Correlation Chart
The statistical analysis conducted on geographies consisting of 375,734,226 people shows a moderate positive correlation between the proportion of Croatians and percentage of population with at least 8th grade education in the United States with a correlation coefficient (R) of 0.422 and weighted average of 97.2%. Similarly, the statistical analysis conducted on geographies consisting of 162,727,113 people shows a weak negative correlation between the proportion of Indonesians and percentage of population with at least 8th grade education in the United States with a correlation coefficient (R) of -0.261 and weighted average of 94.1%, a difference of 3.3%.
8th Grade Correlation Summary
| Measurement | Croatian | Indonesian |
| Minimum | 95.4% | 81.6% |
| Maximum | 100.0% | 100.0% |
| Range | 4.6% | 18.4% |
| Mean | 98.9% | 93.3% |
| Median | 99.0% | 94.0% |
| Interquartile 25% (IQ1) | 98.4% | 91.6% |
| Interquartile 75% (IQ3) | 100.0% | 96.0% |
| Interquartile Range (IQR) | 1.6% | 4.4% |
| Standard Deviation (Sample) | 1.1% | 4.1% |
| Standard Deviation (Population) | 1.1% | 4.1% |
Similar Demographics by 8th Grade
Demographics Similar to Croatians by 8th Grade
In terms of 8th grade, the demographic groups most similar to Croatians are Danish (97.2%, a difference of 0.020%), Welsh (97.2%, a difference of 0.050%), Scottish (97.3%, a difference of 0.060%), French Canadian (97.2%, a difference of 0.060%), and Scandinavian (97.2%, a difference of 0.060%).
| Demographics | Rating | Rank | 8th Grade |
| Alaskan Athabascans | 100.0 /100 | #13 | Exceptional 97.3% |
| English | 100.0 /100 | #14 | Exceptional 97.3% |
| Pennsylvania Germans | 100.0 /100 | #15 | Exceptional 97.3% |
| Tlingit-Haida | 100.0 /100 | #16 | Exceptional 97.3% |
| Irish | 100.0 /100 | #17 | Exceptional 97.3% |
| Lithuanians | 100.0 /100 | #18 | Exceptional 97.3% |
| Scottish | 100.0 /100 | #19 | Exceptional 97.3% |
| Croatians | 100.0 /100 | #20 | Exceptional 97.2% |
| Danes | 100.0 /100 | #21 | Exceptional 97.2% |
| Welsh | 100.0 /100 | #22 | Exceptional 97.2% |
| French Canadians | 100.0 /100 | #23 | Exceptional 97.2% |
| Scandinavians | 100.0 /100 | #24 | Exceptional 97.2% |
| Czechs | 100.0 /100 | #25 | Exceptional 97.1% |
| French | 100.0 /100 | #26 | Exceptional 97.1% |
| Scotch-Irish | 100.0 /100 | #27 | Exceptional 97.1% |
Demographics Similar to Indonesians by 8th Grade
In terms of 8th grade, the demographic groups most similar to Indonesians are Cuban (94.1%, a difference of 0.030%), Immigrants from Burma/Myanmar (94.1%, a difference of 0.030%), Immigrants from South Eastern Asia (94.2%, a difference of 0.040%), Haitian (94.2%, a difference of 0.050%), and Immigrants from Laos (94.1%, a difference of 0.050%).
| Demographics | Rating | Rank | 8th Grade |
| Immigrants | Grenada | 0.0 /100 | #291 | Tragic 94.3% |
| Bangladeshis | 0.0 /100 | #292 | Tragic 94.3% |
| Yaqui | 0.0 /100 | #293 | Tragic 94.2% |
| Houma | 0.0 /100 | #294 | Tragic 94.2% |
| Fijians | 0.0 /100 | #295 | Tragic 94.2% |
| Haitians | 0.0 /100 | #296 | Tragic 94.2% |
| Immigrants | South Eastern Asia | 0.0 /100 | #297 | Tragic 94.2% |
| Indonesians | 0.0 /100 | #298 | Tragic 94.1% |
| Cubans | 0.0 /100 | #299 | Tragic 94.1% |
| Immigrants | Burma/Myanmar | 0.0 /100 | #300 | Tragic 94.1% |
| Immigrants | Laos | 0.0 /100 | #301 | Tragic 94.1% |
| Sri Lankans | 0.0 /100 | #302 | Tragic 94.0% |
| Immigrants | Dominica | 0.0 /100 | #303 | Tragic 94.0% |
| Guyanese | 0.0 /100 | #304 | Tragic 93.9% |
| Immigrants | Haiti | 0.0 /100 | #305 | Tragic 93.9% |