Creek vs White/Caucasian Single Father Poverty
COMPARE
Creek
White/Caucasian
Single Father Poverty
Single Father Poverty Comparison
Creek
Whites/Caucasians
19.8%
SINGLE FATHER POVERTY
0.0/ 100
METRIC RATING
322nd/ 347
METRIC RANK
18.4%
SINGLE FATHER POVERTY
0.0/ 100
METRIC RATING
299th/ 347
METRIC RANK
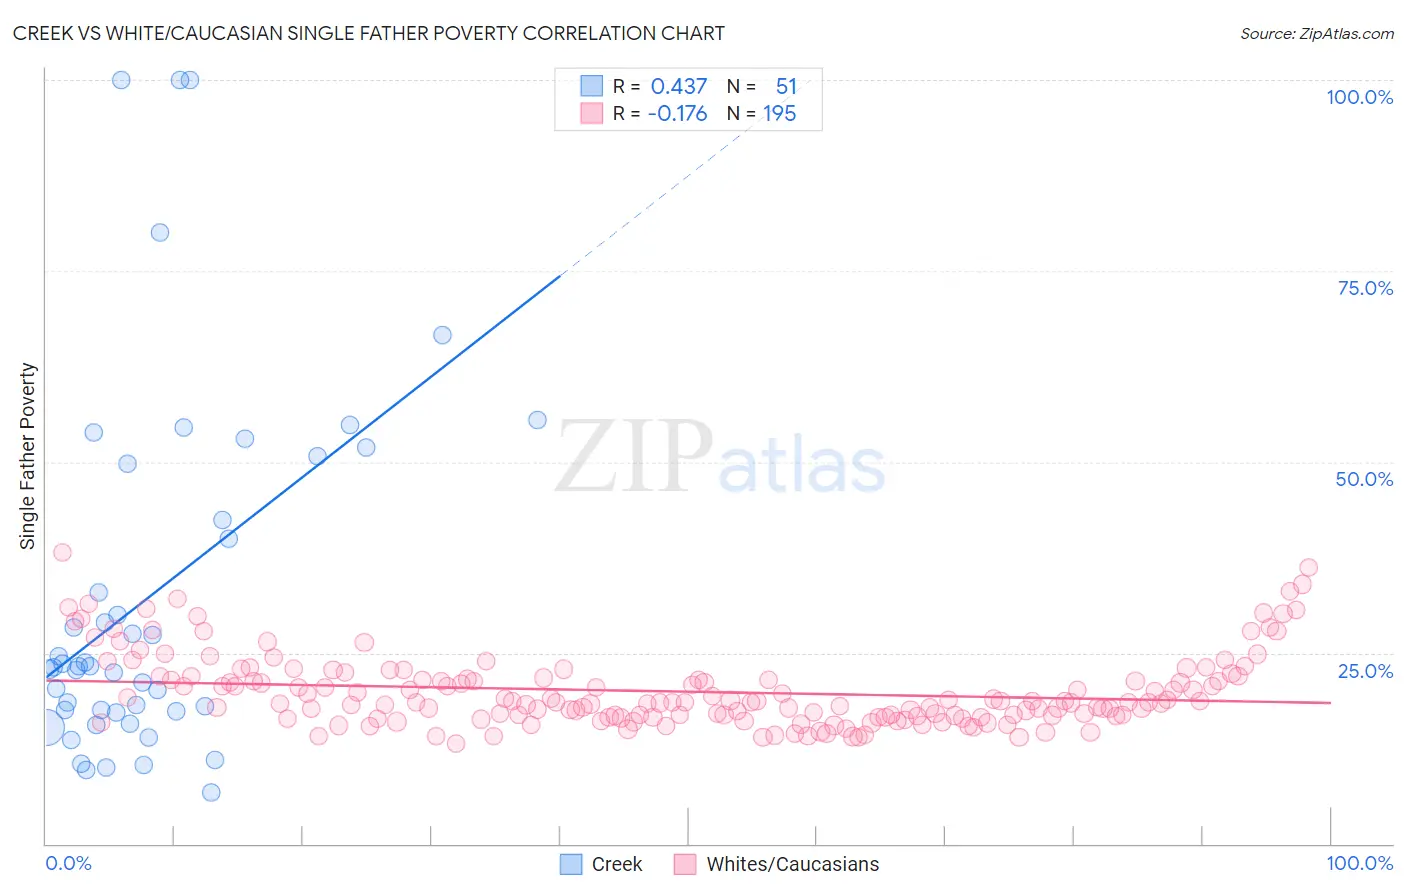
Creek vs White/Caucasian Single Father Poverty Correlation Chart
The statistical analysis conducted on geographies consisting of 156,600,877 people shows a moderate positive correlation between the proportion of Creek and poverty level among single fathers in the United States with a correlation coefficient (R) of 0.437 and weighted average of 19.8%. Similarly, the statistical analysis conducted on geographies consisting of 414,032,364 people shows a poor negative correlation between the proportion of Whites/Caucasians and poverty level among single fathers in the United States with a correlation coefficient (R) of -0.176 and weighted average of 18.4%, a difference of 8.1%.
Single Father Poverty Correlation Summary
| Measurement | Creek | White/Caucasian |
| Minimum | 6.7% | 13.1% |
| Maximum | 100.0% | 38.1% |
| Range | 93.3% | 25.0% |
| Mean | 32.5% | 19.9% |
| Median | 23.2% | 18.5% |
| Interquartile 25% (IQ1) | 17.4% | 16.7% |
| Interquartile 75% (IQ3) | 49.8% | 21.7% |
| Interquartile Range (IQR) | 32.4% | 5.0% |
| Standard Deviation (Sample) | 23.7% | 4.7% |
| Standard Deviation (Population) | 23.5% | 4.7% |
Similar Demographics by Single Father Poverty
Demographics Similar to Creek by Single Father Poverty
In terms of single father poverty, the demographic groups most similar to Creek are Pennsylvania German (20.0%, a difference of 0.90%), Cherokee (19.6%, a difference of 1.0%), American (20.1%, a difference of 1.1%), Inupiat (19.5%, a difference of 1.9%), and Black/African American (20.4%, a difference of 2.7%).
| Demographics | Rating | Rank | Single Father Poverty |
| Chickasaw | 0.0 /100 | #315 | Tragic 19.0% |
| Osage | 0.0 /100 | #316 | Tragic 19.0% |
| Dominicans | 0.0 /100 | #317 | Tragic 19.1% |
| Dutch West Indians | 0.0 /100 | #318 | Tragic 19.2% |
| Slovaks | 0.0 /100 | #319 | Tragic 19.3% |
| Inupiat | 0.0 /100 | #320 | Tragic 19.5% |
| Cherokee | 0.0 /100 | #321 | Tragic 19.6% |
| Creek | 0.0 /100 | #322 | Tragic 19.8% |
| Pennsylvania Germans | 0.0 /100 | #323 | Tragic 20.0% |
| Americans | 0.0 /100 | #324 | Tragic 20.1% |
| Blacks/African Americans | 0.0 /100 | #325 | Tragic 20.4% |
| Immigrants | Yemen | 0.0 /100 | #326 | Tragic 20.6% |
| Choctaw | 0.0 /100 | #327 | Tragic 20.7% |
| Pueblo | 0.0 /100 | #328 | Tragic 21.1% |
| Colville | 0.0 /100 | #329 | Tragic 21.4% |
Demographics Similar to Whites/Caucasians by Single Father Poverty
In terms of single father poverty, the demographic groups most similar to Whites/Caucasians are African (18.3%, a difference of 0.21%), Immigrants from Dominican Republic (18.4%, a difference of 0.32%), Hungarian (18.5%, a difference of 0.53%), Comanche (18.5%, a difference of 0.64%), and Celtic (18.5%, a difference of 0.68%).
| Demographics | Rating | Rank | Single Father Poverty |
| Immigrants | Bahamas | 0.0 /100 | #292 | Tragic 18.1% |
| Alaska Natives | 0.0 /100 | #293 | Tragic 18.1% |
| U.S. Virgin Islanders | 0.0 /100 | #294 | Tragic 18.1% |
| Yakama | 0.0 /100 | #295 | Tragic 18.1% |
| Seminole | 0.0 /100 | #296 | Tragic 18.1% |
| French | 0.0 /100 | #297 | Tragic 18.2% |
| Africans | 0.0 /100 | #298 | Tragic 18.3% |
| Whites/Caucasians | 0.0 /100 | #299 | Tragic 18.4% |
| Immigrants | Dominican Republic | 0.0 /100 | #300 | Tragic 18.4% |
| Hungarians | 0.0 /100 | #301 | Tragic 18.5% |
| Comanche | 0.0 /100 | #302 | Tragic 18.5% |
| Celtics | 0.0 /100 | #303 | Tragic 18.5% |
| Ute | 0.0 /100 | #304 | Tragic 18.5% |
| Blackfeet | 0.0 /100 | #305 | Tragic 18.5% |
| Scotch-Irish | 0.0 /100 | #306 | Tragic 18.6% |