Immigrants from Kenya vs Soviet Union Family Poverty
COMPARE
Immigrants from Kenya
Soviet Union
Family Poverty
Family Poverty Comparison
Immigrants from Kenya
Soviet Union
9.2%
FAMILY POVERTY
34.0/ 100
METRIC RATING
188th/ 347
METRIC RANK
8.3%
FAMILY POVERTY
90.8/ 100
METRIC RATING
124th/ 347
METRIC RANK
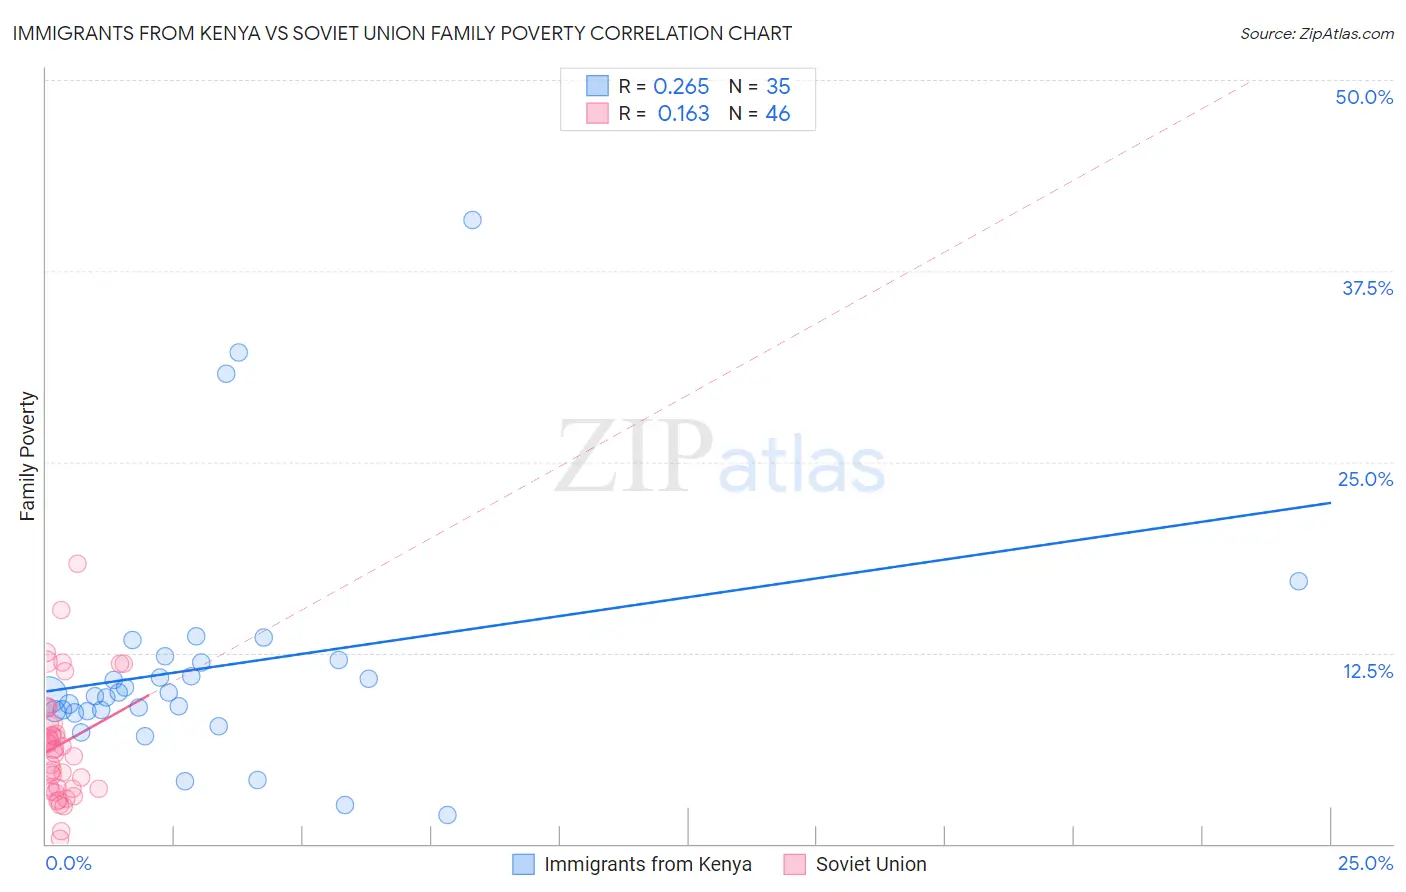
Immigrants from Kenya vs Soviet Union Family Poverty Correlation Chart
The statistical analysis conducted on geographies consisting of 217,776,212 people shows a weak positive correlation between the proportion of Immigrants from Kenya and poverty level among families in the United States with a correlation coefficient (R) of 0.265 and weighted average of 9.2%. Similarly, the statistical analysis conducted on geographies consisting of 43,439,449 people shows a poor positive correlation between the proportion of Soviet Union and poverty level among families in the United States with a correlation coefficient (R) of 0.163 and weighted average of 8.3%, a difference of 10.5%.
Family Poverty Correlation Summary
| Measurement | Immigrants from Kenya | Soviet Union |
| Minimum | 1.9% | 0.36% |
| Maximum | 40.8% | 18.3% |
| Range | 39.0% | 18.0% |
| Mean | 11.6% | 6.5% |
| Median | 9.8% | 6.2% |
| Interquartile 25% (IQ1) | 8.7% | 3.6% |
| Interquartile 75% (IQ3) | 12.0% | 7.9% |
| Interquartile Range (IQR) | 3.3% | 4.2% |
| Standard Deviation (Sample) | 7.9% | 3.8% |
| Standard Deviation (Population) | 7.8% | 3.7% |
Similar Demographics by Family Poverty
Demographics Similar to Immigrants from Kenya by Family Poverty
In terms of family poverty, the demographic groups most similar to Immigrants from Kenya are Delaware (9.2%, a difference of 0.20%), Colombian (9.2%, a difference of 0.29%), Immigrants from Afghanistan (9.2%, a difference of 0.29%), Arab (9.2%, a difference of 0.37%), and Immigrants from Saudi Arabia (9.1%, a difference of 0.63%).
| Demographics | Rating | Rank | Family Poverty |
| Hmong | 40.2 /100 | #181 | Average 9.1% |
| Immigrants | Morocco | 40.2 /100 | #182 | Average 9.1% |
| Uruguayans | 39.2 /100 | #183 | Fair 9.1% |
| South American Indians | 38.7 /100 | #184 | Fair 9.1% |
| Immigrants | Saudi Arabia | 38.6 /100 | #185 | Fair 9.1% |
| Colombians | 36.1 /100 | #186 | Fair 9.2% |
| Delaware | 35.4 /100 | #187 | Fair 9.2% |
| Immigrants | Kenya | 34.0 /100 | #188 | Fair 9.2% |
| Immigrants | Afghanistan | 32.1 /100 | #189 | Fair 9.2% |
| Arabs | 31.5 /100 | #190 | Fair 9.2% |
| Ugandans | 28.7 /100 | #191 | Fair 9.3% |
| Spanish | 28.7 /100 | #192 | Fair 9.3% |
| Immigrants | Western Asia | 28.2 /100 | #193 | Fair 9.3% |
| South Americans | 28.1 /100 | #194 | Fair 9.3% |
| Venezuelans | 27.4 /100 | #195 | Fair 9.3% |
Demographics Similar to Soviet Union by Family Poverty
In terms of family poverty, the demographic groups most similar to Soviet Union are Pakistani (8.3%, a difference of 0.040%), Palestinian (8.3%, a difference of 0.10%), Paraguayan (8.3%, a difference of 0.17%), Native Hawaiian (8.3%, a difference of 0.18%), and Icelander (8.3%, a difference of 0.24%).
| Demographics | Rating | Rank | Family Poverty |
| Immigrants | Russia | 93.2 /100 | #117 | Exceptional 8.2% |
| Immigrants | Western Europe | 92.9 /100 | #118 | Exceptional 8.2% |
| French | 92.8 /100 | #119 | Exceptional 8.3% |
| Immigrants | Egypt | 91.6 /100 | #120 | Exceptional 8.3% |
| Native Hawaiians | 91.3 /100 | #121 | Exceptional 8.3% |
| Paraguayans | 91.2 /100 | #122 | Exceptional 8.3% |
| Palestinians | 91.1 /100 | #123 | Exceptional 8.3% |
| Soviet Union | 90.8 /100 | #124 | Exceptional 8.3% |
| Pakistanis | 90.8 /100 | #125 | Exceptional 8.3% |
| Icelanders | 90.3 /100 | #126 | Exceptional 8.3% |
| Immigrants | Hungary | 89.9 /100 | #127 | Excellent 8.4% |
| Argentineans | 89.6 /100 | #128 | Excellent 8.4% |
| Portuguese | 89.2 /100 | #129 | Excellent 8.4% |
| Immigrants | Bosnia and Herzegovina | 88.6 /100 | #130 | Excellent 8.4% |
| Puget Sound Salish | 88.6 /100 | #131 | Excellent 8.4% |