Hispanic or Latino vs Samoan Receiving Food Stamps
COMPARE
Hispanic or Latino
Samoan
Receiving Food Stamps
Receiving Food Stamps Comparison
Hispanics or Latinos
Samoans
15.8%
RECEIVING FOOD STAMPS
0.0/ 100
METRIC RATING
299th/ 347
METRIC RANK
12.1%
RECEIVING FOOD STAMPS
31.0/ 100
METRIC RATING
192nd/ 347
METRIC RANK
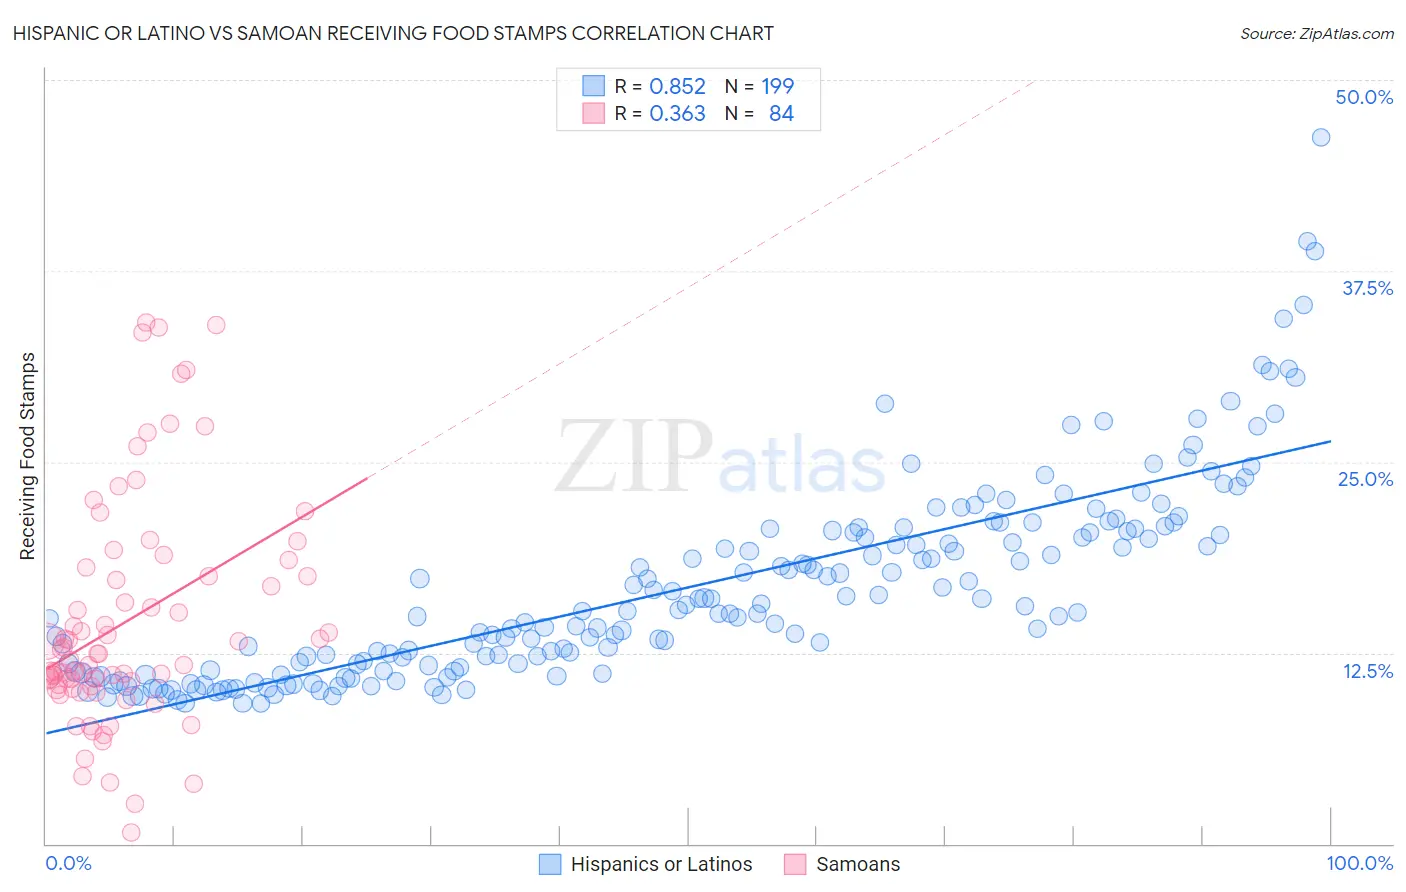
Hispanic or Latino vs Samoan Receiving Food Stamps Correlation Chart
The statistical analysis conducted on geographies consisting of 573,421,418 people shows a very strong positive correlation between the proportion of Hispanics or Latinos and percentage of population receiving government assistance and/or food stamps in the United States with a correlation coefficient (R) of 0.852 and weighted average of 15.8%. Similarly, the statistical analysis conducted on geographies consisting of 224,983,999 people shows a mild positive correlation between the proportion of Samoans and percentage of population receiving government assistance and/or food stamps in the United States with a correlation coefficient (R) of 0.363 and weighted average of 12.1%, a difference of 31.2%.
Receiving Food Stamps Correlation Summary
| Measurement | Hispanic or Latino | Samoan |
| Minimum | 9.2% | 0.70% |
| Maximum | 46.2% | 34.1% |
| Range | 37.1% | 33.4% |
| Mean | 16.7% | 14.6% |
| Median | 15.2% | 12.4% |
| Interquartile 25% (IQ1) | 11.4% | 10.4% |
| Interquartile 75% (IQ3) | 20.4% | 17.8% |
| Interquartile Range (IQR) | 9.0% | 7.4% |
| Standard Deviation (Sample) | 6.5% | 7.5% |
| Standard Deviation (Population) | 6.4% | 7.5% |
Similar Demographics by Receiving Food Stamps
Demographics Similar to Hispanics or Latinos by Receiving Food Stamps
In terms of receiving food stamps, the demographic groups most similar to Hispanics or Latinos are Immigrants from Trinidad and Tobago (15.8%, a difference of 0.28%), Immigrants from Bangladesh (15.9%, a difference of 0.43%), Immigrants from Bahamas (15.8%, a difference of 0.53%), Tsimshian (15.7%, a difference of 0.69%), and Immigrants from Honduras (15.7%, a difference of 0.70%).
| Demographics | Rating | Rank | Receiving Food Stamps |
| Alaska Natives | 0.0 /100 | #292 | Tragic 15.6% |
| Vietnamese | 0.0 /100 | #293 | Tragic 15.7% |
| Immigrants | Latin America | 0.0 /100 | #294 | Tragic 15.7% |
| Immigrants | Honduras | 0.0 /100 | #295 | Tragic 15.7% |
| Tsimshian | 0.0 /100 | #296 | Tragic 15.7% |
| Immigrants | Bahamas | 0.0 /100 | #297 | Tragic 15.8% |
| Immigrants | Trinidad and Tobago | 0.0 /100 | #298 | Tragic 15.8% |
| Hispanics or Latinos | 0.0 /100 | #299 | Tragic 15.8% |
| Immigrants | Bangladesh | 0.0 /100 | #300 | Tragic 15.9% |
| Trinidadians and Tobagonians | 0.0 /100 | #301 | Tragic 16.0% |
| Immigrants | West Indies | 0.0 /100 | #302 | Tragic 16.1% |
| Nicaraguans | 0.0 /100 | #303 | Tragic 16.1% |
| West Indians | 0.0 /100 | #304 | Tragic 16.3% |
| Immigrants | Azores | 0.0 /100 | #305 | Tragic 16.4% |
| Jamaicans | 0.0 /100 | #306 | Tragic 16.4% |
Demographics Similar to Samoans by Receiving Food Stamps
In terms of receiving food stamps, the demographic groups most similar to Samoans are Venezuelan (12.0%, a difference of 0.18%), Immigrants from Peru (12.0%, a difference of 0.19%), Immigrants from Cameroon (12.0%, a difference of 0.24%), Sudanese (12.0%, a difference of 0.38%), and Immigrants from Fiji (12.1%, a difference of 0.53%).
| Demographics | Rating | Rank | Receiving Food Stamps |
| Immigrants | Iraq | 37.1 /100 | #185 | Fair 12.0% |
| Spanish | 36.9 /100 | #186 | Fair 12.0% |
| Albanians | 35.4 /100 | #187 | Fair 12.0% |
| Sudanese | 33.4 /100 | #188 | Fair 12.0% |
| Immigrants | Cameroon | 32.5 /100 | #189 | Fair 12.0% |
| Immigrants | Peru | 32.2 /100 | #190 | Fair 12.0% |
| Venezuelans | 32.1 /100 | #191 | Fair 12.0% |
| Samoans | 31.0 /100 | #192 | Fair 12.1% |
| Immigrants | Fiji | 27.8 /100 | #193 | Fair 12.1% |
| Immigrants | Sudan | 27.1 /100 | #194 | Fair 12.1% |
| Americans | 26.7 /100 | #195 | Fair 12.2% |
| Iraqis | 26.6 /100 | #196 | Fair 12.2% |
| Delaware | 26.1 /100 | #197 | Fair 12.2% |
| Immigrants | Costa Rica | 25.4 /100 | #198 | Fair 12.2% |
| Portuguese | 25.1 /100 | #199 | Fair 12.2% |