Mongolian vs Immigrants from Eastern Asia Female Poverty Among 18-24 Year Olds
COMPARE
Mongolian
Immigrants from Eastern Asia
Female Poverty Among 18-24 Year Olds
Female Poverty Among 18-24 Year Olds Comparison
Mongolians
Immigrants from Eastern Asia
21.6%
FEMALE POVERTY AMONG 18-24 YEAR OLDS
0.2/ 100
METRIC RATING
270th/ 347
METRIC RANK
19.8%
FEMALE POVERTY AMONG 18-24 YEAR OLDS
79.7/ 100
METRIC RATING
151st/ 347
METRIC RANK
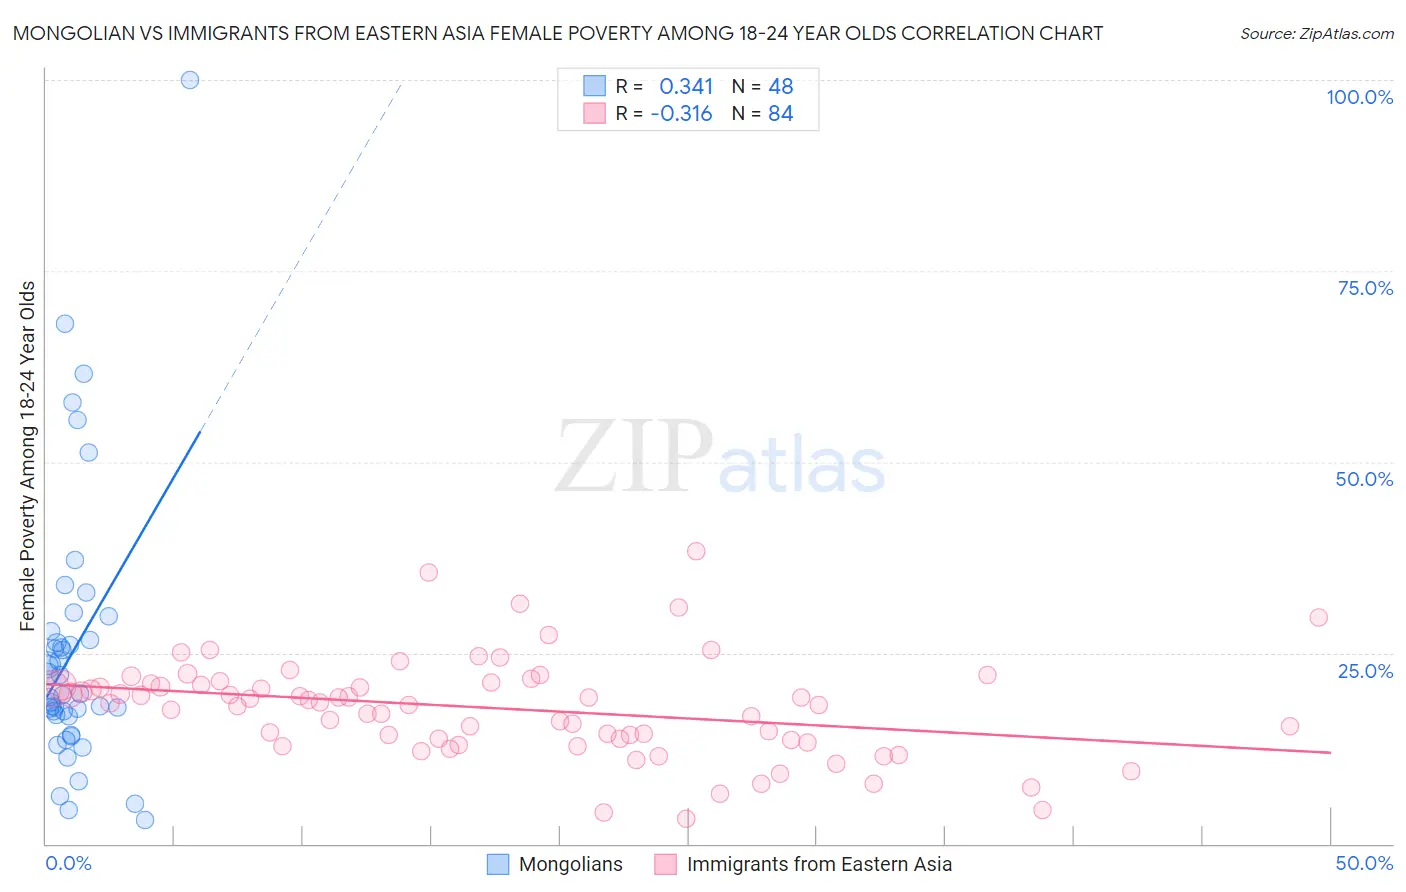
Mongolian vs Immigrants from Eastern Asia Female Poverty Among 18-24 Year Olds Correlation Chart
The statistical analysis conducted on geographies consisting of 139,425,379 people shows a mild positive correlation between the proportion of Mongolians and poverty level among females between the ages 18 and 24 in the United States with a correlation coefficient (R) of 0.341 and weighted average of 21.6%. Similarly, the statistical analysis conducted on geographies consisting of 480,513,058 people shows a mild negative correlation between the proportion of Immigrants from Eastern Asia and poverty level among females between the ages 18 and 24 in the United States with a correlation coefficient (R) of -0.316 and weighted average of 19.8%, a difference of 9.3%.
Female Poverty Among 18-24 Year Olds Correlation Summary
| Measurement | Mongolian | Immigrants from Eastern Asia |
| Minimum | 3.0% | 3.2% |
| Maximum | 100.0% | 38.3% |
| Range | 97.0% | 35.1% |
| Mean | 25.3% | 17.8% |
| Median | 19.6% | 18.4% |
| Interquartile 25% (IQ1) | 16.8% | 13.6% |
| Interquartile 75% (IQ3) | 27.2% | 20.9% |
| Interquartile Range (IQR) | 10.5% | 7.3% |
| Standard Deviation (Sample) | 18.1% | 6.5% |
| Standard Deviation (Population) | 17.9% | 6.5% |
Similar Demographics by Female Poverty Among 18-24 Year Olds
Demographics Similar to Mongolians by Female Poverty Among 18-24 Year Olds
In terms of female poverty among 18-24 year olds, the demographic groups most similar to Mongolians are Scotch-Irish (21.6%, a difference of 0.010%), Celtic (21.6%, a difference of 0.030%), Immigrants from Burma/Myanmar (21.6%, a difference of 0.090%), American (21.6%, a difference of 0.23%), and Basque (21.7%, a difference of 0.29%).
| Demographics | Rating | Rank | Female Poverty Among 18-24 Year Olds |
| Icelanders | 0.3 /100 | #263 | Tragic 21.5% |
| Hondurans | 0.3 /100 | #264 | Tragic 21.5% |
| Immigrants | Nonimmigrants | 0.3 /100 | #265 | Tragic 21.5% |
| Alaska Natives | 0.3 /100 | #266 | Tragic 21.5% |
| Americans | 0.3 /100 | #267 | Tragic 21.6% |
| Immigrants | Burma/Myanmar | 0.2 /100 | #268 | Tragic 21.6% |
| Celtics | 0.2 /100 | #269 | Tragic 21.6% |
| Mongolians | 0.2 /100 | #270 | Tragic 21.6% |
| Scotch-Irish | 0.2 /100 | #271 | Tragic 21.6% |
| Basques | 0.2 /100 | #272 | Tragic 21.7% |
| New Zealanders | 0.2 /100 | #273 | Tragic 21.7% |
| Immigrants | Honduras | 0.1 /100 | #274 | Tragic 21.8% |
| Immigrants | Bangladesh | 0.1 /100 | #275 | Tragic 21.8% |
| Bahamians | 0.1 /100 | #276 | Tragic 21.8% |
| Immigrants | Switzerland | 0.1 /100 | #277 | Tragic 21.8% |
Demographics Similar to Immigrants from Eastern Asia by Female Poverty Among 18-24 Year Olds
In terms of female poverty among 18-24 year olds, the demographic groups most similar to Immigrants from Eastern Asia are Syrian (19.8%, a difference of 0.040%), Yugoslavian (19.8%, a difference of 0.050%), Immigrants from Oceania (19.7%, a difference of 0.12%), Immigrants from Japan (19.8%, a difference of 0.12%), and Immigrants from Latin America (19.7%, a difference of 0.13%).
| Demographics | Rating | Rank | Female Poverty Among 18-24 Year Olds |
| Immigrants | Northern Africa | 84.1 /100 | #144 | Excellent 19.7% |
| Canadians | 83.8 /100 | #145 | Excellent 19.7% |
| Immigrants | Bosnia and Herzegovina | 83.6 /100 | #146 | Excellent 19.7% |
| Immigrants | Austria | 83.1 /100 | #147 | Excellent 19.7% |
| Immigrants | Latin America | 81.3 /100 | #148 | Excellent 19.7% |
| Immigrants | Oceania | 81.2 /100 | #149 | Excellent 19.7% |
| Syrians | 80.2 /100 | #150 | Excellent 19.8% |
| Immigrants | Eastern Asia | 79.7 /100 | #151 | Good 19.8% |
| Yugoslavians | 79.0 /100 | #152 | Good 19.8% |
| Immigrants | Japan | 78.1 /100 | #153 | Good 19.8% |
| Immigrants | Zimbabwe | 76.7 /100 | #154 | Good 19.8% |
| Hungarians | 76.6 /100 | #155 | Good 19.8% |
| Immigrants | Belgium | 76.4 /100 | #156 | Good 19.8% |
| Danes | 75.5 /100 | #157 | Good 19.8% |
| Immigrants | Lebanon | 75.3 /100 | #158 | Good 19.8% |