Creek vs Cheyenne Seniors Poverty Over the Age of 65
COMPARE
Creek
Cheyenne
Seniors Poverty Over the Age of 65
Seniors Poverty Over the Age of 65 Comparison
Creek
Cheyenne
10.9%
SENIORS POVERTY OVER THE AGE OF 65
49.6/ 100
METRIC RATING
175th/ 347
METRIC RANK
13.9%
SENIORS POVERTY OVER THE AGE OF 65
0.0/ 100
METRIC RATING
294th/ 347
METRIC RANK
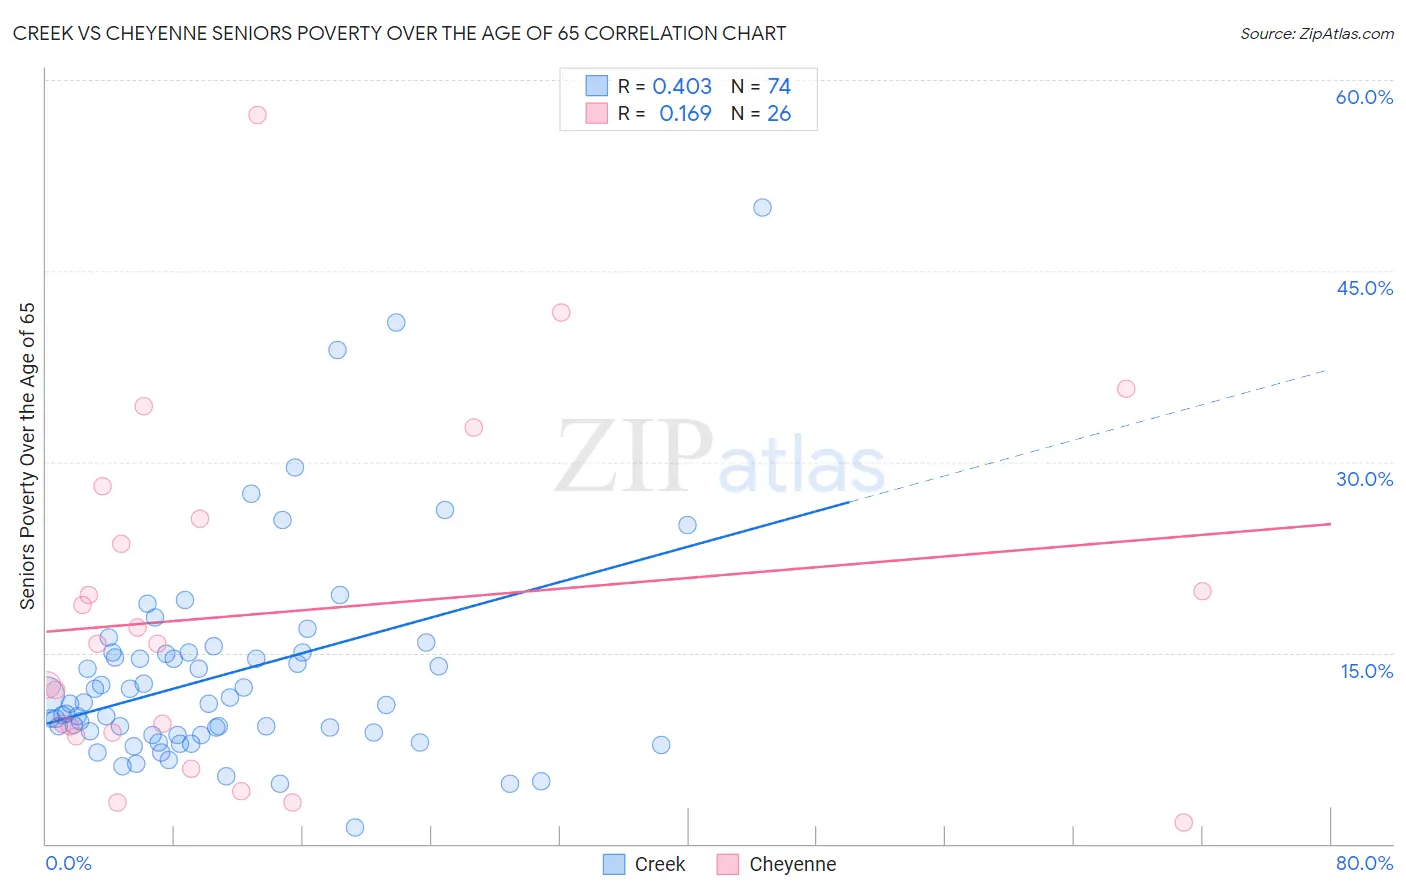
Creek vs Cheyenne Seniors Poverty Over the Age of 65 Correlation Chart
The statistical analysis conducted on geographies consisting of 178,107,079 people shows a moderate positive correlation between the proportion of Creek and poverty level among seniors over the age of 65 in the United States with a correlation coefficient (R) of 0.403 and weighted average of 10.9%. Similarly, the statistical analysis conducted on geographies consisting of 80,672,543 people shows a poor positive correlation between the proportion of Cheyenne and poverty level among seniors over the age of 65 in the United States with a correlation coefficient (R) of 0.169 and weighted average of 13.9%, a difference of 26.9%.
Seniors Poverty Over the Age of 65 Correlation Summary
| Measurement | Creek | Cheyenne |
| Minimum | 1.2% | 1.6% |
| Maximum | 50.0% | 57.3% |
| Range | 48.8% | 55.6% |
| Mean | 13.3% | 18.2% |
| Median | 11.0% | 15.7% |
| Interquartile 25% (IQ1) | 8.6% | 8.8% |
| Interquartile 75% (IQ3) | 15.0% | 25.6% |
| Interquartile Range (IQR) | 6.4% | 16.8% |
| Standard Deviation (Sample) | 8.3% | 13.6% |
| Standard Deviation (Population) | 8.2% | 13.3% |
Similar Demographics by Seniors Poverty Over the Age of 65
Demographics Similar to Creek by Seniors Poverty Over the Age of 65
In terms of seniors poverty over the age of 65, the demographic groups most similar to Creek are Immigrants from Sudan (10.9%, a difference of 0.040%), Spaniard (10.9%, a difference of 0.10%), Immigrants from Malaysia (11.0%, a difference of 0.15%), Cherokee (11.0%, a difference of 0.20%), and German Russian (11.0%, a difference of 0.24%).
| Demographics | Rating | Rank | Seniors Poverty Over the Age of 65 |
| Mongolians | 58.0 /100 | #168 | Average 10.9% |
| Sri Lankans | 56.8 /100 | #169 | Average 10.9% |
| Immigrants | Eastern Europe | 55.8 /100 | #170 | Average 10.9% |
| Immigrants | Nonimmigrants | 55.1 /100 | #171 | Average 10.9% |
| Immigrants | Syria | 54.7 /100 | #172 | Average 10.9% |
| Spaniards | 50.7 /100 | #173 | Average 10.9% |
| Immigrants | Sudan | 50.0 /100 | #174 | Average 10.9% |
| Creek | 49.6 /100 | #175 | Average 10.9% |
| Immigrants | Malaysia | 47.9 /100 | #176 | Average 11.0% |
| Cherokee | 47.3 /100 | #177 | Average 11.0% |
| German Russians | 46.9 /100 | #178 | Average 11.0% |
| Immigrants | Northern Africa | 44.6 /100 | #179 | Average 11.0% |
| Immigrants | Thailand | 43.5 /100 | #180 | Average 11.0% |
| Immigrants | Eastern Africa | 43.4 /100 | #181 | Average 11.0% |
| Immigrants | Fiji | 42.0 /100 | #182 | Average 11.0% |
Demographics Similar to Cheyenne by Seniors Poverty Over the Age of 65
In terms of seniors poverty over the age of 65, the demographic groups most similar to Cheyenne are Apache (13.9%, a difference of 0.19%), Immigrants from Guatemala (13.8%, a difference of 0.42%), Immigrants from Jamaica (13.9%, a difference of 0.46%), Vietnamese (14.0%, a difference of 0.53%), and Spanish American Indian (13.8%, a difference of 0.61%).
| Demographics | Rating | Rank | Seniors Poverty Over the Age of 65 |
| Immigrants | Mexico | 0.0 /100 | #287 | Tragic 13.6% |
| Belizeans | 0.0 /100 | #288 | Tragic 13.6% |
| Jamaicans | 0.0 /100 | #289 | Tragic 13.6% |
| Immigrants | Central America | 0.0 /100 | #290 | Tragic 13.6% |
| Blacks/African Americans | 0.0 /100 | #291 | Tragic 13.7% |
| Spanish American Indians | 0.0 /100 | #292 | Tragic 13.8% |
| Immigrants | Guatemala | 0.0 /100 | #293 | Tragic 13.8% |
| Cheyenne | 0.0 /100 | #294 | Tragic 13.9% |
| Apache | 0.0 /100 | #295 | Tragic 13.9% |
| Immigrants | Jamaica | 0.0 /100 | #296 | Tragic 13.9% |
| Vietnamese | 0.0 /100 | #297 | Tragic 14.0% |
| Immigrants | Belize | 0.0 /100 | #298 | Tragic 14.0% |
| Ecuadorians | 0.0 /100 | #299 | Tragic 14.0% |
| Immigrants | Uzbekistan | 0.0 /100 | #300 | Tragic 14.0% |
| U.S. Virgin Islanders | 0.0 /100 | #301 | Tragic 14.0% |