Potawatomi vs Belgian Receiving Food Stamps
COMPARE
Potawatomi
Belgian
Receiving Food Stamps
Receiving Food Stamps Comparison
Potawatomi
Belgians
12.5%
RECEIVING FOOD STAMPS
14.6/ 100
METRIC RATING
208th/ 347
METRIC RANK
10.2%
RECEIVING FOOD STAMPS
97.7/ 100
METRIC RATING
93rd/ 347
METRIC RANK
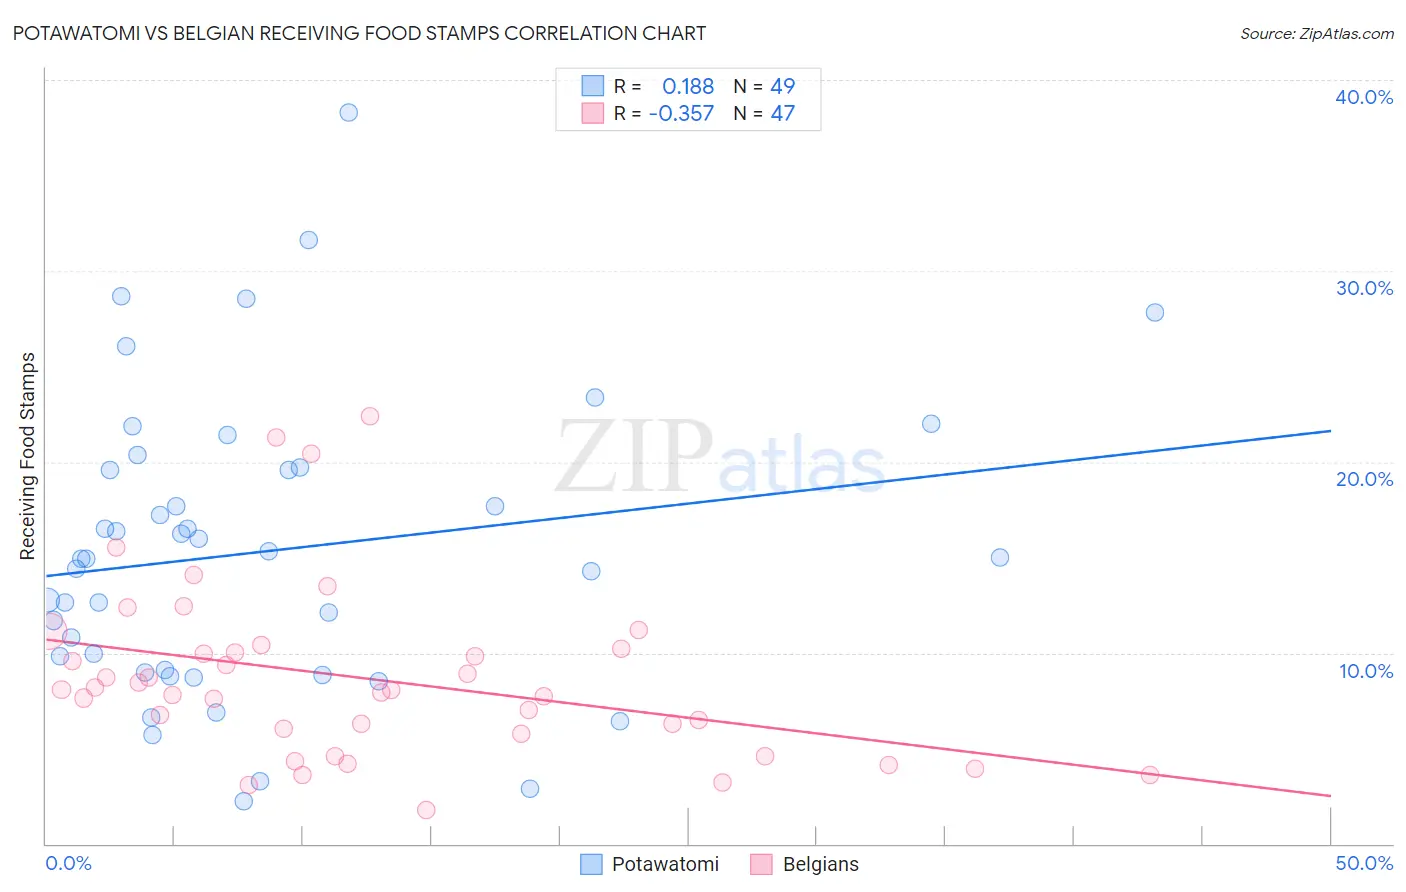
Potawatomi vs Belgian Receiving Food Stamps Correlation Chart
The statistical analysis conducted on geographies consisting of 117,725,542 people shows a poor positive correlation between the proportion of Potawatomi and percentage of population receiving government assistance and/or food stamps in the United States with a correlation coefficient (R) of 0.188 and weighted average of 12.5%. Similarly, the statistical analysis conducted on geographies consisting of 355,046,721 people shows a mild negative correlation between the proportion of Belgians and percentage of population receiving government assistance and/or food stamps in the United States with a correlation coefficient (R) of -0.357 and weighted average of 10.2%, a difference of 22.2%.
Receiving Food Stamps Correlation Summary
| Measurement | Potawatomi | Belgian |
| Minimum | 2.2% | 1.8% |
| Maximum | 38.3% | 22.4% |
| Range | 36.1% | 20.6% |
| Mean | 15.3% | 8.7% |
| Median | 15.0% | 8.1% |
| Interquartile 25% (IQ1) | 9.1% | 5.8% |
| Interquartile 75% (IQ3) | 19.6% | 10.2% |
| Interquartile Range (IQR) | 10.6% | 4.4% |
| Standard Deviation (Sample) | 7.7% | 4.6% |
| Standard Deviation (Population) | 7.7% | 4.5% |
Similar Demographics by Receiving Food Stamps
Demographics Similar to Potawatomi by Receiving Food Stamps
In terms of receiving food stamps, the demographic groups most similar to Potawatomi are South American (12.4%, a difference of 0.36%), Immigrants from Sierra Leone (12.5%, a difference of 0.47%), Immigrants from Uruguay (12.5%, a difference of 0.50%), Immigrants from Thailand (12.4%, a difference of 0.62%), and Aleut (12.4%, a difference of 0.68%).
| Demographics | Rating | Rank | Receiving Food Stamps |
| Ugandans | 22.5 /100 | #201 | Fair 12.2% |
| Immigrants | Venezuela | 20.1 /100 | #202 | Fair 12.3% |
| Shoshone | 17.7 /100 | #203 | Poor 12.4% |
| Immigrants | Nonimmigrants | 17.6 /100 | #204 | Poor 12.4% |
| Aleuts | 17.3 /100 | #205 | Poor 12.4% |
| Immigrants | Thailand | 17.0 /100 | #206 | Poor 12.4% |
| South Americans | 16.0 /100 | #207 | Poor 12.4% |
| Potawatomi | 14.6 /100 | #208 | Poor 12.5% |
| Immigrants | Sierra Leone | 12.9 /100 | #209 | Poor 12.5% |
| Immigrants | Uruguay | 12.8 /100 | #210 | Poor 12.5% |
| Colombians | 10.2 /100 | #211 | Poor 12.6% |
| Malaysians | 8.5 /100 | #212 | Tragic 12.7% |
| Moroccans | 7.6 /100 | #213 | Tragic 12.8% |
| Immigrants | Africa | 7.6 /100 | #214 | Tragic 12.8% |
| Native Hawaiians | 6.7 /100 | #215 | Tragic 12.8% |
Demographics Similar to Belgians by Receiving Food Stamps
In terms of receiving food stamps, the demographic groups most similar to Belgians are Irish (10.2%, a difference of 0.38%), Jordanian (10.2%, a difference of 0.39%), Finnish (10.2%, a difference of 0.42%), Immigrants from Greece (10.3%, a difference of 0.53%), and Basque (10.3%, a difference of 0.55%).
| Demographics | Rating | Rank | Receiving Food Stamps |
| Immigrants | Norway | 98.4 /100 | #86 | Exceptional 10.0% |
| Egyptians | 98.4 /100 | #87 | Exceptional 10.0% |
| Immigrants | Kuwait | 98.4 /100 | #88 | Exceptional 10.0% |
| Immigrants | France | 98.3 /100 | #89 | Exceptional 10.1% |
| Finns | 97.9 /100 | #90 | Exceptional 10.2% |
| Jordanians | 97.9 /100 | #91 | Exceptional 10.2% |
| Irish | 97.9 /100 | #92 | Exceptional 10.2% |
| Belgians | 97.7 /100 | #93 | Exceptional 10.2% |
| Immigrants | Greece | 97.4 /100 | #94 | Exceptional 10.3% |
| Basques | 97.4 /100 | #95 | Exceptional 10.3% |
| Welsh | 97.3 /100 | #96 | Exceptional 10.3% |
| Czechoslovakians | 97.2 /100 | #97 | Exceptional 10.3% |
| Immigrants | Egypt | 97.1 /100 | #98 | Exceptional 10.3% |
| Serbians | 97.0 /100 | #99 | Exceptional 10.3% |
| Immigrants | Western Europe | 96.9 /100 | #100 | Exceptional 10.3% |