Dutch West Indian vs Belgian Receiving Food Stamps
COMPARE
Dutch West Indian
Belgian
Receiving Food Stamps
Receiving Food Stamps Comparison
Dutch West Indians
Belgians
14.3%
RECEIVING FOOD STAMPS
0.2/ 100
METRIC RATING
267th/ 347
METRIC RANK
10.2%
RECEIVING FOOD STAMPS
97.7/ 100
METRIC RATING
93rd/ 347
METRIC RANK
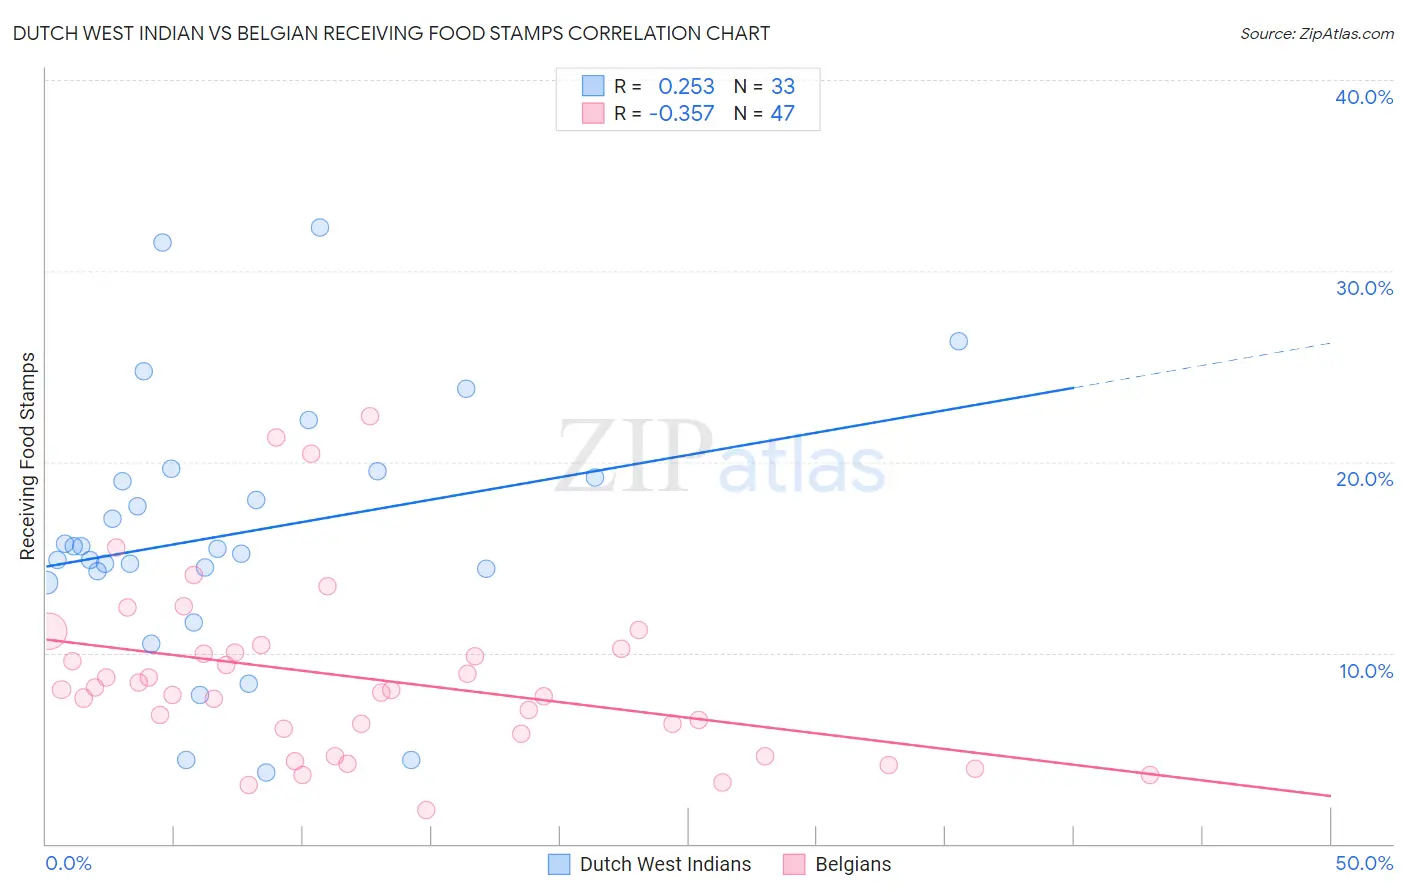
Dutch West Indian vs Belgian Receiving Food Stamps Correlation Chart
The statistical analysis conducted on geographies consisting of 85,754,540 people shows a weak positive correlation between the proportion of Dutch West Indians and percentage of population receiving government assistance and/or food stamps in the United States with a correlation coefficient (R) of 0.253 and weighted average of 14.3%. Similarly, the statistical analysis conducted on geographies consisting of 355,046,721 people shows a mild negative correlation between the proportion of Belgians and percentage of population receiving government assistance and/or food stamps in the United States with a correlation coefficient (R) of -0.357 and weighted average of 10.2%, a difference of 40.5%.
Receiving Food Stamps Correlation Summary
| Measurement | Dutch West Indian | Belgian |
| Minimum | 3.8% | 1.8% |
| Maximum | 32.3% | 22.4% |
| Range | 28.5% | 20.6% |
| Mean | 16.2% | 8.7% |
| Median | 15.5% | 8.1% |
| Interquartile 25% (IQ1) | 14.0% | 5.8% |
| Interquartile 75% (IQ3) | 19.4% | 10.2% |
| Interquartile Range (IQR) | 5.4% | 4.4% |
| Standard Deviation (Sample) | 6.7% | 4.6% |
| Standard Deviation (Population) | 6.6% | 4.5% |
Similar Demographics by Receiving Food Stamps
Demographics Similar to Dutch West Indians by Receiving Food Stamps
In terms of receiving food stamps, the demographic groups most similar to Dutch West Indians are Cheyenne (14.3%, a difference of 0.22%), Blackfeet (14.3%, a difference of 0.30%), Immigrants from Uzbekistan (14.3%, a difference of 0.36%), Paiute (14.3%, a difference of 0.45%), and Immigrants from Portugal (14.3%, a difference of 0.45%).
| Demographics | Rating | Rank | Receiving Food Stamps |
| Central Americans | 0.3 /100 | #260 | Tragic 14.1% |
| Immigrants | Congo | 0.3 /100 | #261 | Tragic 14.1% |
| Paiute | 0.2 /100 | #262 | Tragic 14.3% |
| Immigrants | Portugal | 0.2 /100 | #263 | Tragic 14.3% |
| Immigrants | Uzbekistan | 0.2 /100 | #264 | Tragic 14.3% |
| Blackfeet | 0.2 /100 | #265 | Tragic 14.3% |
| Cheyenne | 0.2 /100 | #266 | Tragic 14.3% |
| Dutch West Indians | 0.2 /100 | #267 | Tragic 14.3% |
| Guatemalans | 0.1 /100 | #268 | Tragic 14.4% |
| Nepalese | 0.1 /100 | #269 | Tragic 14.6% |
| Mexicans | 0.1 /100 | #270 | Tragic 14.6% |
| Immigrants | Guatemala | 0.1 /100 | #271 | Tragic 14.6% |
| Chippewa | 0.1 /100 | #272 | Tragic 14.7% |
| Alaskan Athabascans | 0.1 /100 | #273 | Tragic 14.7% |
| Immigrants | Western Africa | 0.1 /100 | #274 | Tragic 14.7% |
Demographics Similar to Belgians by Receiving Food Stamps
In terms of receiving food stamps, the demographic groups most similar to Belgians are Irish (10.2%, a difference of 0.38%), Jordanian (10.2%, a difference of 0.39%), Finnish (10.2%, a difference of 0.42%), Immigrants from Greece (10.3%, a difference of 0.53%), and Basque (10.3%, a difference of 0.55%).
| Demographics | Rating | Rank | Receiving Food Stamps |
| Immigrants | Norway | 98.4 /100 | #86 | Exceptional 10.0% |
| Egyptians | 98.4 /100 | #87 | Exceptional 10.0% |
| Immigrants | Kuwait | 98.4 /100 | #88 | Exceptional 10.0% |
| Immigrants | France | 98.3 /100 | #89 | Exceptional 10.1% |
| Finns | 97.9 /100 | #90 | Exceptional 10.2% |
| Jordanians | 97.9 /100 | #91 | Exceptional 10.2% |
| Irish | 97.9 /100 | #92 | Exceptional 10.2% |
| Belgians | 97.7 /100 | #93 | Exceptional 10.2% |
| Immigrants | Greece | 97.4 /100 | #94 | Exceptional 10.3% |
| Basques | 97.4 /100 | #95 | Exceptional 10.3% |
| Welsh | 97.3 /100 | #96 | Exceptional 10.3% |
| Czechoslovakians | 97.2 /100 | #97 | Exceptional 10.3% |
| Immigrants | Egypt | 97.1 /100 | #98 | Exceptional 10.3% |
| Serbians | 97.0 /100 | #99 | Exceptional 10.3% |
| Immigrants | Western Europe | 96.9 /100 | #100 | Exceptional 10.3% |