Vietnamese vs Lithuanian Family Poverty
COMPARE
Vietnamese
Lithuanian
Family Poverty
Family Poverty Comparison
Vietnamese
Lithuanians
11.5%
FAMILY POVERTY
0.0/ 100
METRIC RATING
287th/ 347
METRIC RANK
7.2%
FAMILY POVERTY
99.8/ 100
METRIC RATING
15th/ 347
METRIC RANK
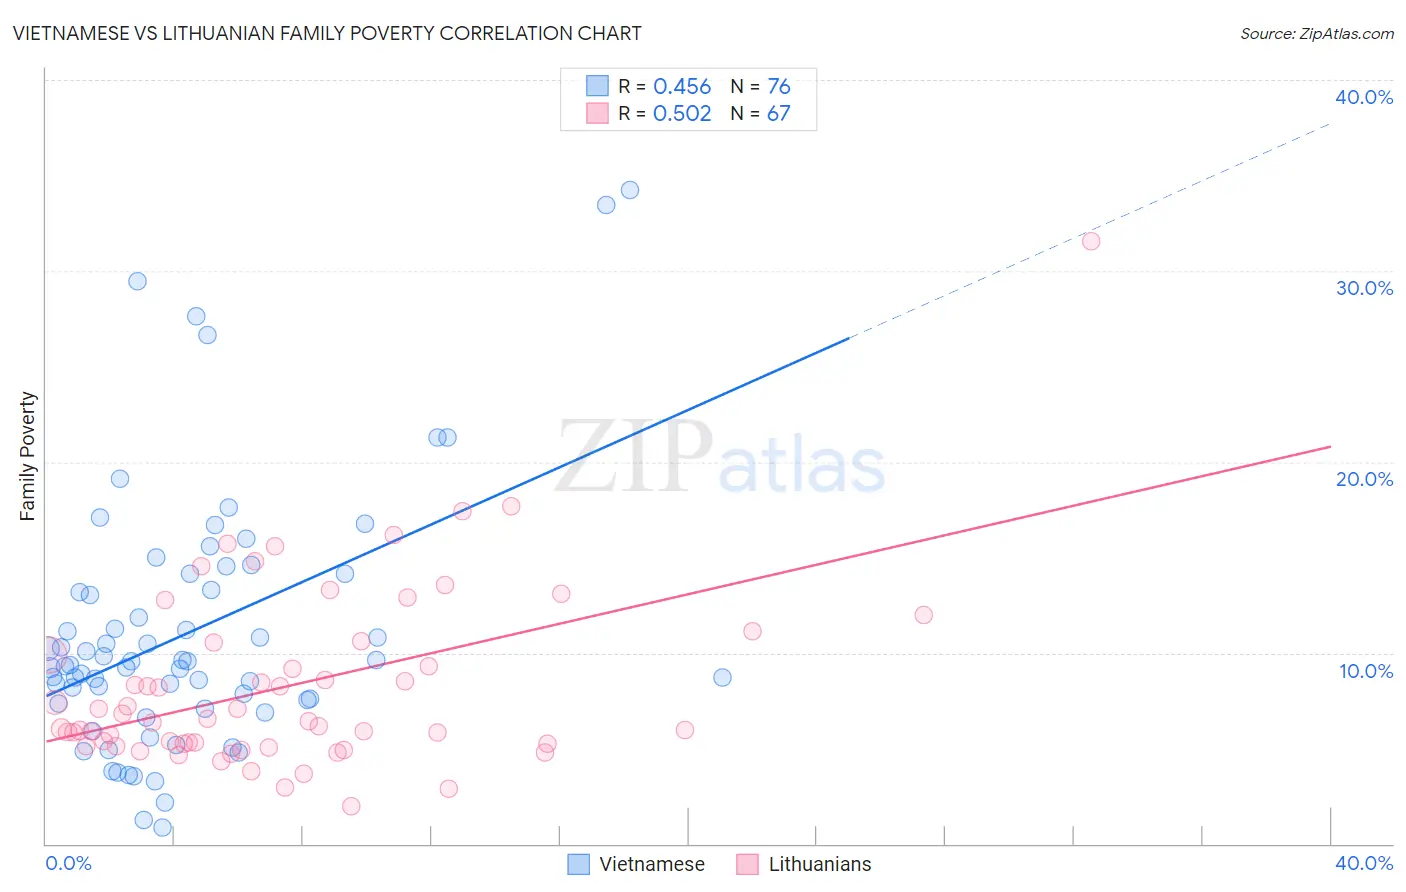
Vietnamese vs Lithuanian Family Poverty Correlation Chart
The statistical analysis conducted on geographies consisting of 170,550,296 people shows a moderate positive correlation between the proportion of Vietnamese and poverty level among families in the United States with a correlation coefficient (R) of 0.456 and weighted average of 11.5%. Similarly, the statistical analysis conducted on geographies consisting of 420,202,329 people shows a substantial positive correlation between the proportion of Lithuanians and poverty level among families in the United States with a correlation coefficient (R) of 0.502 and weighted average of 7.2%, a difference of 60.0%.
Family Poverty Correlation Summary
| Measurement | Vietnamese | Lithuanian |
| Minimum | 0.88% | 2.0% |
| Maximum | 34.2% | 31.6% |
| Range | 33.4% | 29.6% |
| Mean | 11.1% | 8.3% |
| Median | 9.4% | 6.4% |
| Interquartile 25% (IQ1) | 7.4% | 5.2% |
| Interquartile 75% (IQ3) | 13.7% | 10.5% |
| Interquartile Range (IQR) | 6.3% | 5.3% |
| Standard Deviation (Sample) | 6.8% | 4.8% |
| Standard Deviation (Population) | 6.7% | 4.8% |
Similar Demographics by Family Poverty
Demographics Similar to Vietnamese by Family Poverty
In terms of family poverty, the demographic groups most similar to Vietnamese are Immigrants from Belize (11.5%, a difference of 0.19%), Immigrants from Barbados (11.5%, a difference of 0.24%), West Indian (11.5%, a difference of 0.25%), Senegalese (11.5%, a difference of 0.27%), and Haitian (11.5%, a difference of 0.31%).
| Demographics | Rating | Rank | Family Poverty |
| Belizeans | 0.0 /100 | #280 | Tragic 11.3% |
| Immigrants | West Indies | 0.0 /100 | #281 | Tragic 11.3% |
| Immigrants | Cuba | 0.0 /100 | #282 | Tragic 11.3% |
| Indonesians | 0.0 /100 | #283 | Tragic 11.3% |
| Yaqui | 0.0 /100 | #284 | Tragic 11.3% |
| Barbadians | 0.0 /100 | #285 | Tragic 11.3% |
| Senegalese | 0.0 /100 | #286 | Tragic 11.5% |
| Vietnamese | 0.0 /100 | #287 | Tragic 11.5% |
| Immigrants | Belize | 0.0 /100 | #288 | Tragic 11.5% |
| Immigrants | Barbados | 0.0 /100 | #289 | Tragic 11.5% |
| West Indians | 0.0 /100 | #290 | Tragic 11.5% |
| Haitians | 0.0 /100 | #291 | Tragic 11.5% |
| Immigrants | Somalia | 0.0 /100 | #292 | Tragic 11.5% |
| Immigrants | Cabo Verde | 0.0 /100 | #293 | Tragic 11.6% |
| Immigrants | St. Vincent and the Grenadines | 0.0 /100 | #294 | Tragic 11.6% |
Demographics Similar to Lithuanians by Family Poverty
In terms of family poverty, the demographic groups most similar to Lithuanians are Immigrants from South Central Asia (7.2%, a difference of 0.27%), Luxembourger (7.2%, a difference of 0.50%), Immigrants from Lithuania (7.2%, a difference of 0.51%), Eastern European (7.2%, a difference of 0.81%), and Swedish (7.1%, a difference of 0.88%).
| Demographics | Rating | Rank | Family Poverty |
| Bhutanese | 99.9 /100 | #8 | Exceptional 7.0% |
| Latvians | 99.9 /100 | #9 | Exceptional 7.1% |
| Bulgarians | 99.8 /100 | #10 | Exceptional 7.1% |
| Immigrants | Singapore | 99.8 /100 | #11 | Exceptional 7.1% |
| Maltese | 99.8 /100 | #12 | Exceptional 7.1% |
| Swedes | 99.8 /100 | #13 | Exceptional 7.1% |
| Iranians | 99.8 /100 | #14 | Exceptional 7.1% |
| Lithuanians | 99.8 /100 | #15 | Exceptional 7.2% |
| Immigrants | South Central Asia | 99.8 /100 | #16 | Exceptional 7.2% |
| Luxembourgers | 99.8 /100 | #17 | Exceptional 7.2% |
| Immigrants | Lithuania | 99.8 /100 | #18 | Exceptional 7.2% |
| Eastern Europeans | 99.7 /100 | #19 | Exceptional 7.2% |
| Immigrants | Hong Kong | 99.7 /100 | #20 | Exceptional 7.3% |
| Immigrants | Iran | 99.7 /100 | #21 | Exceptional 7.3% |
| Danes | 99.7 /100 | #22 | Exceptional 7.3% |