Comanche vs Sierra Leonean Unemployment Among Youth under 25 years
COMPARE
Comanche
Sierra Leonean
Unemployment Among Youth under 25 years
Unemployment Among Youth under 25 years Comparison
Comanche
Sierra Leoneans
11.8%
UNEMPLOYMENT AMONG YOUTH UNDER 25 YEARS
12.1/ 100
METRIC RATING
208th/ 347
METRIC RANK
13.3%
UNEMPLOYMENT AMONG YOUTH UNDER 25 YEARS
0.0/ 100
METRIC RATING
282nd/ 347
METRIC RANK
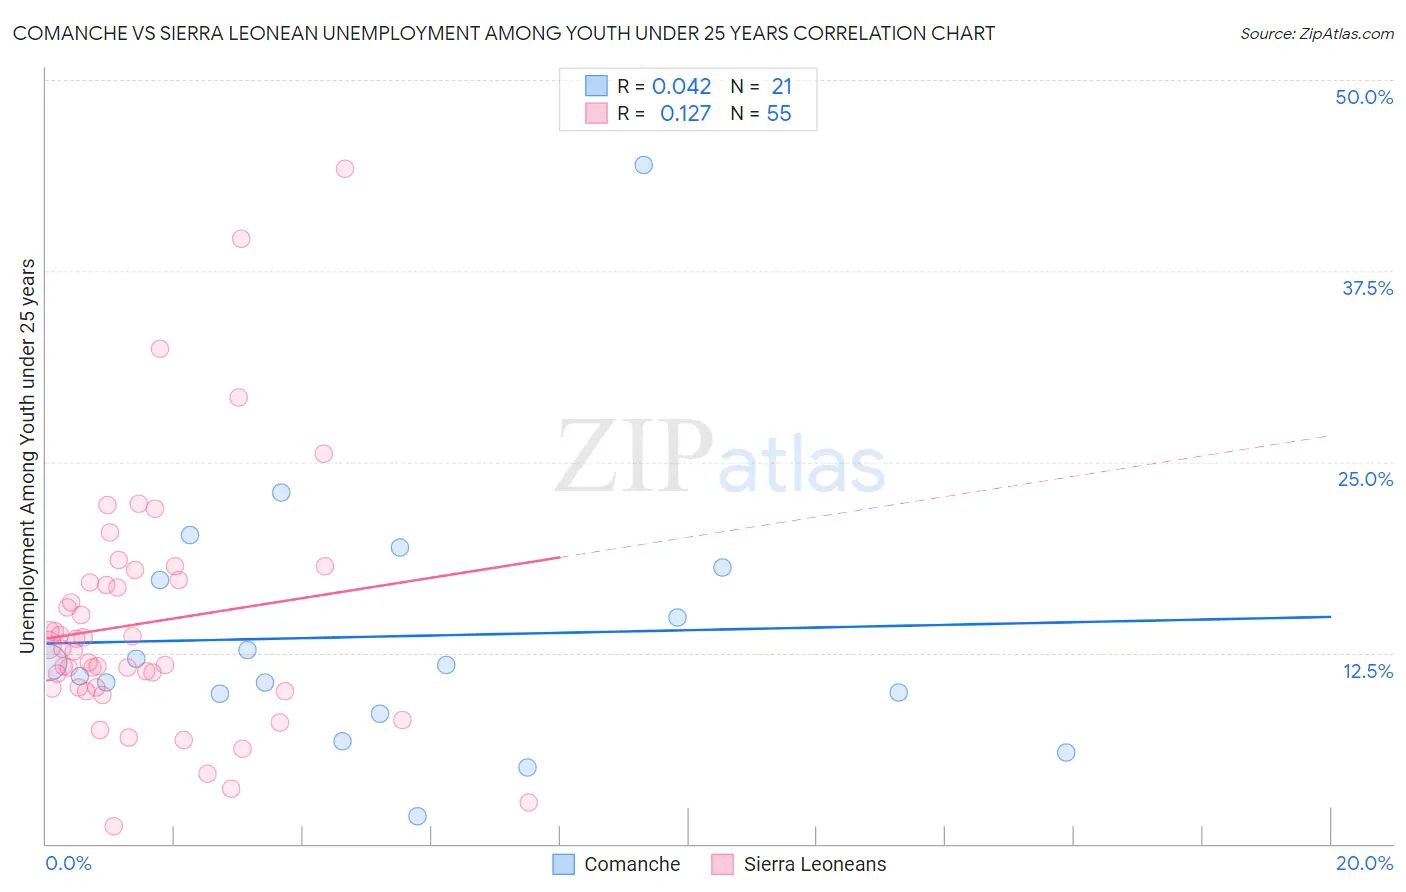
Comanche vs Sierra Leonean Unemployment Among Youth under 25 years Correlation Chart
The statistical analysis conducted on geographies consisting of 109,118,325 people shows no correlation between the proportion of Comanche and unemployment rate among youth under the age of 25 in the United States with a correlation coefficient (R) of 0.042 and weighted average of 11.8%. Similarly, the statistical analysis conducted on geographies consisting of 83,173,871 people shows a poor positive correlation between the proportion of Sierra Leoneans and unemployment rate among youth under the age of 25 in the United States with a correlation coefficient (R) of 0.127 and weighted average of 13.3%, a difference of 12.2%.
Unemployment Among Youth under 25 years Correlation Summary
| Measurement | Comanche | Sierra Leonean |
| Minimum | 1.8% | 1.1% |
| Maximum | 44.4% | 44.2% |
| Range | 42.6% | 43.1% |
| Mean | 13.6% | 14.5% |
| Median | 11.7% | 12.8% |
| Interquartile 25% (IQ1) | 9.2% | 10.2% |
| Interquartile 75% (IQ3) | 17.7% | 17.3% |
| Interquartile Range (IQR) | 8.5% | 7.1% |
| Standard Deviation (Sample) | 8.8% | 8.1% |
| Standard Deviation (Population) | 8.6% | 8.0% |
Similar Demographics by Unemployment Among Youth under 25 years
Demographics Similar to Comanche by Unemployment Among Youth under 25 years
In terms of unemployment among youth under 25 years, the demographic groups most similar to Comanche are Immigrants from Southern Europe (11.8%, a difference of 0.020%), Immigrants from Pakistan (11.8%, a difference of 0.040%), Immigrants from Lebanon (11.8%, a difference of 0.080%), Peruvian (11.8%, a difference of 0.17%), and Assyrian/Chaldean/Syriac (11.9%, a difference of 0.23%).
| Demographics | Rating | Rank | Unemployment Among Youth under 25 years |
| Palestinians | 16.0 /100 | #201 | Poor 11.8% |
| Marshallese | 15.8 /100 | #202 | Poor 11.8% |
| Immigrants | Peru | 15.3 /100 | #203 | Poor 11.8% |
| Immigrants | Costa Rica | 15.2 /100 | #204 | Poor 11.8% |
| Peruvians | 14.0 /100 | #205 | Poor 11.8% |
| Immigrants | Pakistan | 12.6 /100 | #206 | Poor 11.8% |
| Immigrants | Southern Europe | 12.3 /100 | #207 | Poor 11.8% |
| Comanche | 12.1 /100 | #208 | Poor 11.8% |
| Immigrants | Lebanon | 11.3 /100 | #209 | Poor 11.8% |
| Assyrians/Chaldeans/Syriacs | 9.8 /100 | #210 | Tragic 11.9% |
| Immigrants | Philippines | 9.2 /100 | #211 | Tragic 11.9% |
| Colombians | 9.1 /100 | #212 | Tragic 11.9% |
| South Americans | 8.5 /100 | #213 | Tragic 11.9% |
| Costa Ricans | 8.2 /100 | #214 | Tragic 11.9% |
| Samoans | 7.4 /100 | #215 | Tragic 11.9% |
Demographics Similar to Sierra Leoneans by Unemployment Among Youth under 25 years
In terms of unemployment among youth under 25 years, the demographic groups most similar to Sierra Leoneans are Armenian (13.3%, a difference of 0.010%), Immigrants from Cameroon (13.3%, a difference of 0.020%), Ute (13.3%, a difference of 0.040%), Lumbee (13.3%, a difference of 0.040%), and Ghanaian (13.3%, a difference of 0.12%).
| Demographics | Rating | Rank | Unemployment Among Youth under 25 years |
| Bermudans | 0.0 /100 | #275 | Tragic 13.0% |
| Immigrants | Uzbekistan | 0.0 /100 | #276 | Tragic 13.1% |
| Bahamians | 0.0 /100 | #277 | Tragic 13.1% |
| Africans | 0.0 /100 | #278 | Tragic 13.2% |
| Cajuns | 0.0 /100 | #279 | Tragic 13.2% |
| Ute | 0.0 /100 | #280 | Tragic 13.3% |
| Armenians | 0.0 /100 | #281 | Tragic 13.3% |
| Sierra Leoneans | 0.0 /100 | #282 | Tragic 13.3% |
| Immigrants | Cameroon | 0.0 /100 | #283 | Tragic 13.3% |
| Lumbee | 0.0 /100 | #284 | Tragic 13.3% |
| Ghanaians | 0.0 /100 | #285 | Tragic 13.3% |
| Blackfeet | 0.0 /100 | #286 | Tragic 13.3% |
| Ecuadorians | 0.0 /100 | #287 | Tragic 13.3% |
| Immigrants | Western Africa | 0.0 /100 | #288 | Tragic 13.4% |
| Immigrants | Ghana | 0.0 /100 | #289 | Tragic 13.4% |