Colombian vs Sierra Leonean Family Poverty
COMPARE
Colombian
Sierra Leonean
Family Poverty
Family Poverty Comparison
Colombians
Sierra Leoneans
9.2%
FAMILY POVERTY
36.1/ 100
METRIC RATING
186th/ 347
METRIC RANK
9.5%
FAMILY POVERTY
15.6/ 100
METRIC RATING
207th/ 347
METRIC RANK
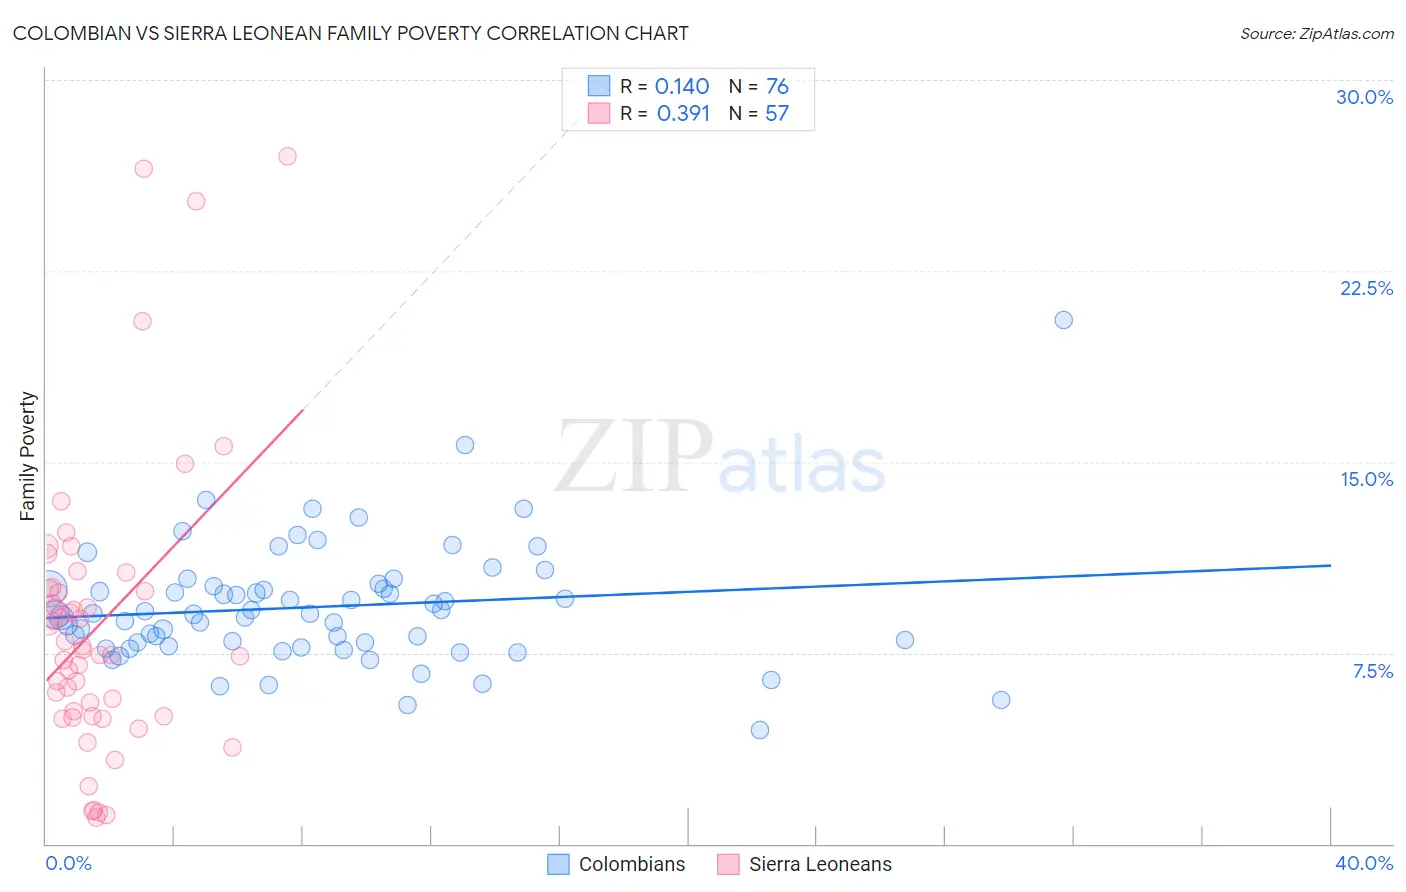
Colombian vs Sierra Leonean Family Poverty Correlation Chart
The statistical analysis conducted on geographies consisting of 418,403,011 people shows a poor positive correlation between the proportion of Colombians and poverty level among families in the United States with a correlation coefficient (R) of 0.140 and weighted average of 9.2%. Similarly, the statistical analysis conducted on geographies consisting of 83,310,136 people shows a mild positive correlation between the proportion of Sierra Leoneans and poverty level among families in the United States with a correlation coefficient (R) of 0.391 and weighted average of 9.5%, a difference of 3.6%.
Family Poverty Correlation Summary
| Measurement | Colombian | Sierra Leonean |
| Minimum | 4.5% | 1.0% |
| Maximum | 20.6% | 27.0% |
| Range | 16.1% | 26.0% |
| Mean | 9.3% | 8.6% |
| Median | 9.0% | 7.6% |
| Interquartile 25% (IQ1) | 7.8% | 5.0% |
| Interquartile 75% (IQ3) | 10.1% | 10.0% |
| Interquartile Range (IQR) | 2.3% | 5.0% |
| Standard Deviation (Sample) | 2.4% | 5.6% |
| Standard Deviation (Population) | 2.4% | 5.6% |
Similar Demographics by Family Poverty
Demographics Similar to Colombians by Family Poverty
In terms of family poverty, the demographic groups most similar to Colombians are Delaware (9.2%, a difference of 0.090%), Immigrants from Kenya (9.2%, a difference of 0.29%), Immigrants from Saudi Arabia (9.1%, a difference of 0.35%), South American Indian (9.1%, a difference of 0.36%), and Uruguayan (9.1%, a difference of 0.43%).
| Demographics | Rating | Rank | Family Poverty |
| Immigrants | Iraq | 44.4 /100 | #179 | Average 9.1% |
| Immigrants | Uganda | 43.4 /100 | #180 | Average 9.1% |
| Hmong | 40.2 /100 | #181 | Average 9.1% |
| Immigrants | Morocco | 40.2 /100 | #182 | Average 9.1% |
| Uruguayans | 39.2 /100 | #183 | Fair 9.1% |
| South American Indians | 38.7 /100 | #184 | Fair 9.1% |
| Immigrants | Saudi Arabia | 38.6 /100 | #185 | Fair 9.1% |
| Colombians | 36.1 /100 | #186 | Fair 9.2% |
| Delaware | 35.4 /100 | #187 | Fair 9.2% |
| Immigrants | Kenya | 34.0 /100 | #188 | Fair 9.2% |
| Immigrants | Afghanistan | 32.1 /100 | #189 | Fair 9.2% |
| Arabs | 31.5 /100 | #190 | Fair 9.2% |
| Ugandans | 28.7 /100 | #191 | Fair 9.3% |
| Spanish | 28.7 /100 | #192 | Fair 9.3% |
| Immigrants | Western Asia | 28.2 /100 | #193 | Fair 9.3% |
Demographics Similar to Sierra Leoneans by Family Poverty
In terms of family poverty, the demographic groups most similar to Sierra Leoneans are Immigrants from Eastern Africa (9.5%, a difference of 0.11%), Immigrants from Uruguay (9.5%, a difference of 0.40%), Immigrants from South America (9.5%, a difference of 0.53%), Aleut (9.5%, a difference of 0.54%), and Immigrants from Lebanon (9.4%, a difference of 0.73%).
| Demographics | Rating | Rank | Family Poverty |
| Immigrants | Costa Rica | 21.7 /100 | #200 | Fair 9.4% |
| Immigrants | Portugal | 20.5 /100 | #201 | Fair 9.4% |
| Immigrants | Sierra Leone | 19.6 /100 | #202 | Poor 9.4% |
| German Russians | 19.4 /100 | #203 | Poor 9.4% |
| Immigrants | Lebanon | 18.9 /100 | #204 | Poor 9.4% |
| Aleuts | 18.0 /100 | #205 | Poor 9.5% |
| Immigrants | South America | 18.0 /100 | #206 | Poor 9.5% |
| Sierra Leoneans | 15.6 /100 | #207 | Poor 9.5% |
| Immigrants | Eastern Africa | 15.1 /100 | #208 | Poor 9.5% |
| Immigrants | Uruguay | 14.0 /100 | #209 | Poor 9.5% |
| Alsatians | 11.3 /100 | #210 | Poor 9.6% |
| Malaysians | 10.6 /100 | #211 | Poor 9.6% |
| Immigrants | Thailand | 9.7 /100 | #212 | Tragic 9.7% |
| Osage | 8.0 /100 | #213 | Tragic 9.7% |
| Immigrants | Micronesia | 6.7 /100 | #214 | Tragic 9.8% |