Paiute vs Immigrants from Cambodia Family Poverty
COMPARE
Paiute
Immigrants from Cambodia
Family Poverty
Family Poverty Comparison
Paiute
Immigrants from Cambodia
13.0%
FAMILY POVERTY
0.0/ 100
METRIC RATING
325th/ 347
METRIC RANK
9.9%
FAMILY POVERTY
4.8/ 100
METRIC RATING
221st/ 347
METRIC RANK
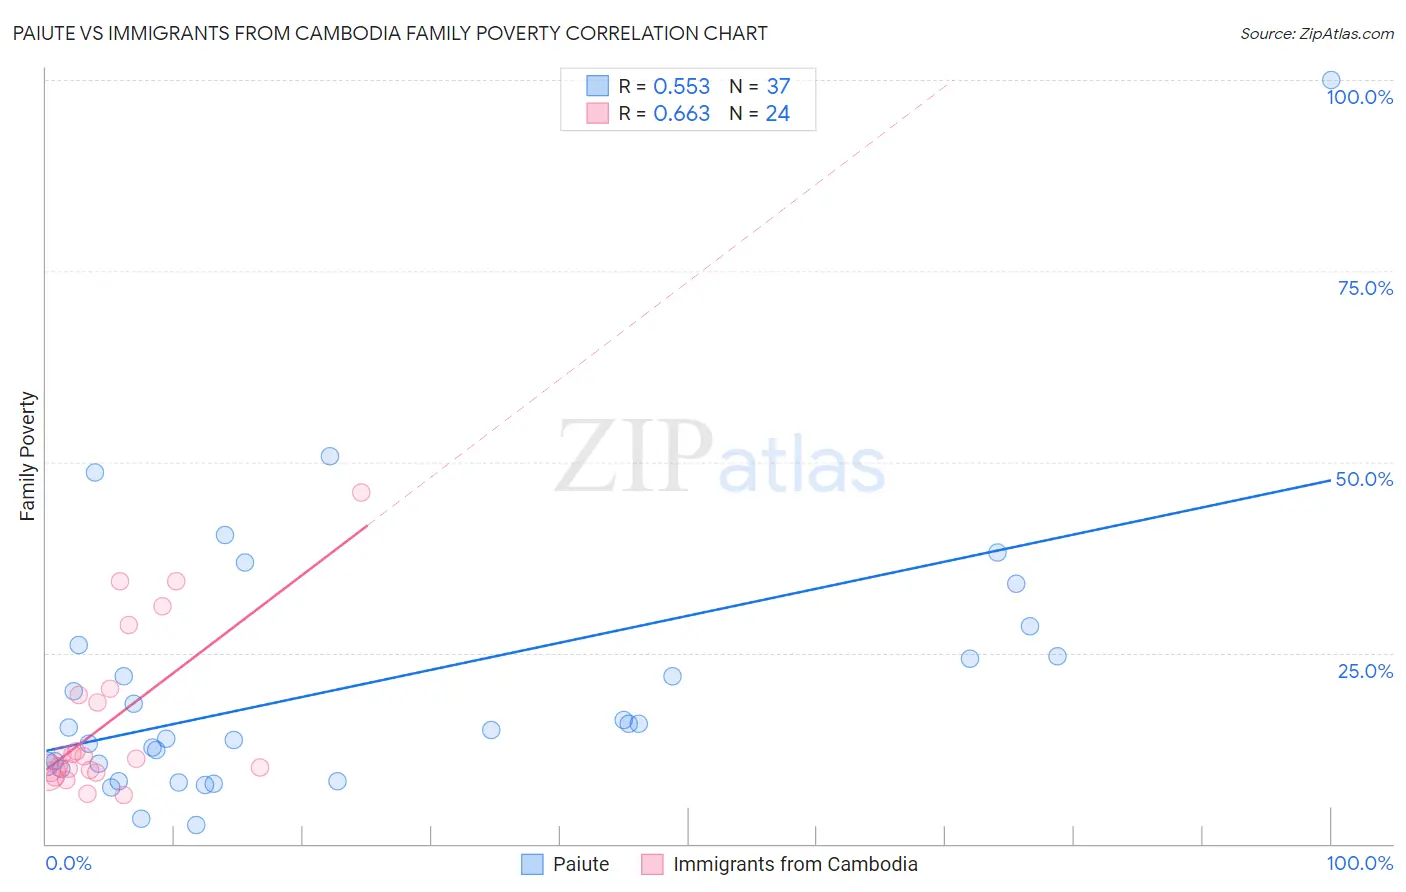
Paiute vs Immigrants from Cambodia Family Poverty Correlation Chart
The statistical analysis conducted on geographies consisting of 58,372,907 people shows a substantial positive correlation between the proportion of Paiute and poverty level among families in the United States with a correlation coefficient (R) of 0.553 and weighted average of 13.0%. Similarly, the statistical analysis conducted on geographies consisting of 204,985,132 people shows a significant positive correlation between the proportion of Immigrants from Cambodia and poverty level among families in the United States with a correlation coefficient (R) of 0.663 and weighted average of 9.9%, a difference of 31.5%.
Family Poverty Correlation Summary
| Measurement | Paiute | Immigrants from Cambodia |
| Minimum | 2.4% | 6.3% |
| Maximum | 100.0% | 45.9% |
| Range | 97.6% | 39.6% |
| Mean | 20.9% | 16.2% |
| Median | 15.2% | 11.3% |
| Interquartile 25% (IQ1) | 10.1% | 9.4% |
| Interquartile 75% (IQ3) | 25.3% | 19.8% |
| Interquartile Range (IQR) | 15.2% | 10.4% |
| Standard Deviation (Sample) | 18.0% | 10.8% |
| Standard Deviation (Population) | 17.8% | 10.5% |
Similar Demographics by Family Poverty
Demographics Similar to Paiute by Family Poverty
In terms of family poverty, the demographic groups most similar to Paiute are Colville (13.0%, a difference of 0.060%), Yakama (13.1%, a difference of 0.75%), Immigrants from Dominica (12.7%, a difference of 2.0%), Menominee (12.7%, a difference of 2.0%), and Central American Indian (13.3%, a difference of 2.4%).
| Demographics | Rating | Rank | Family Poverty |
| U.S. Virgin Islanders | 0.0 /100 | #318 | Tragic 12.4% |
| British West Indians | 0.0 /100 | #319 | Tragic 12.4% |
| Inupiat | 0.0 /100 | #320 | Tragic 12.5% |
| Arapaho | 0.0 /100 | #321 | Tragic 12.7% |
| Immigrants | Honduras | 0.0 /100 | #322 | Tragic 12.7% |
| Menominee | 0.0 /100 | #323 | Tragic 12.7% |
| Immigrants | Dominica | 0.0 /100 | #324 | Tragic 12.7% |
| Paiute | 0.0 /100 | #325 | Tragic 13.0% |
| Colville | 0.0 /100 | #326 | Tragic 13.0% |
| Yakama | 0.0 /100 | #327 | Tragic 13.1% |
| Central American Indians | 0.0 /100 | #328 | Tragic 13.3% |
| Blacks/African Americans | 0.0 /100 | #329 | Tragic 13.3% |
| Natives/Alaskans | 0.0 /100 | #330 | Tragic 14.3% |
| Cheyenne | 0.0 /100 | #331 | Tragic 14.3% |
| Dominicans | 0.0 /100 | #332 | Tragic 14.3% |
Demographics Similar to Immigrants from Cambodia by Family Poverty
In terms of family poverty, the demographic groups most similar to Immigrants from Cambodia are Japanese (9.9%, a difference of 0.030%), Bermudan (9.9%, a difference of 0.27%), Immigrants from Eritrea (9.9%, a difference of 0.33%), Immigrants from Africa (9.9%, a difference of 0.33%), and Panamanian (9.8%, a difference of 0.46%).
| Demographics | Rating | Rank | Family Poverty |
| Immigrants | Micronesia | 6.7 /100 | #214 | Tragic 9.8% |
| Immigrants | Nonimmigrants | 6.7 /100 | #215 | Tragic 9.8% |
| Moroccans | 6.5 /100 | #216 | Tragic 9.8% |
| Americans | 6.2 /100 | #217 | Tragic 9.8% |
| Panamanians | 5.6 /100 | #218 | Tragic 9.8% |
| Immigrants | Eritrea | 5.4 /100 | #219 | Tragic 9.9% |
| Bermudans | 5.3 /100 | #220 | Tragic 9.9% |
| Immigrants | Cambodia | 4.8 /100 | #221 | Tragic 9.9% |
| Japanese | 4.8 /100 | #222 | Tragic 9.9% |
| Immigrants | Africa | 4.3 /100 | #223 | Tragic 9.9% |
| Marshallese | 3.9 /100 | #224 | Tragic 9.9% |
| Immigrants | Immigrants | 3.6 /100 | #225 | Tragic 10.0% |
| Ottawa | 3.3 /100 | #226 | Tragic 10.0% |
| Immigrants | Armenia | 3.3 /100 | #227 | Tragic 10.0% |
| Sudanese | 3.1 /100 | #228 | Tragic 10.0% |