Finnish vs Cree Child Poverty Under the Age of 5
COMPARE
Finnish
Cree
Child Poverty Under the Age of 5
Child Poverty Under the Age of 5 Comparison
Finns
Cree
16.3%
CHILD POVERTY UNDER THE AGE OF 5
88.3/ 100
METRIC RATING
131st/ 347
METRIC RANK
19.7%
CHILD POVERTY UNDER THE AGE OF 5
0.4/ 100
METRIC RATING
246th/ 347
METRIC RANK
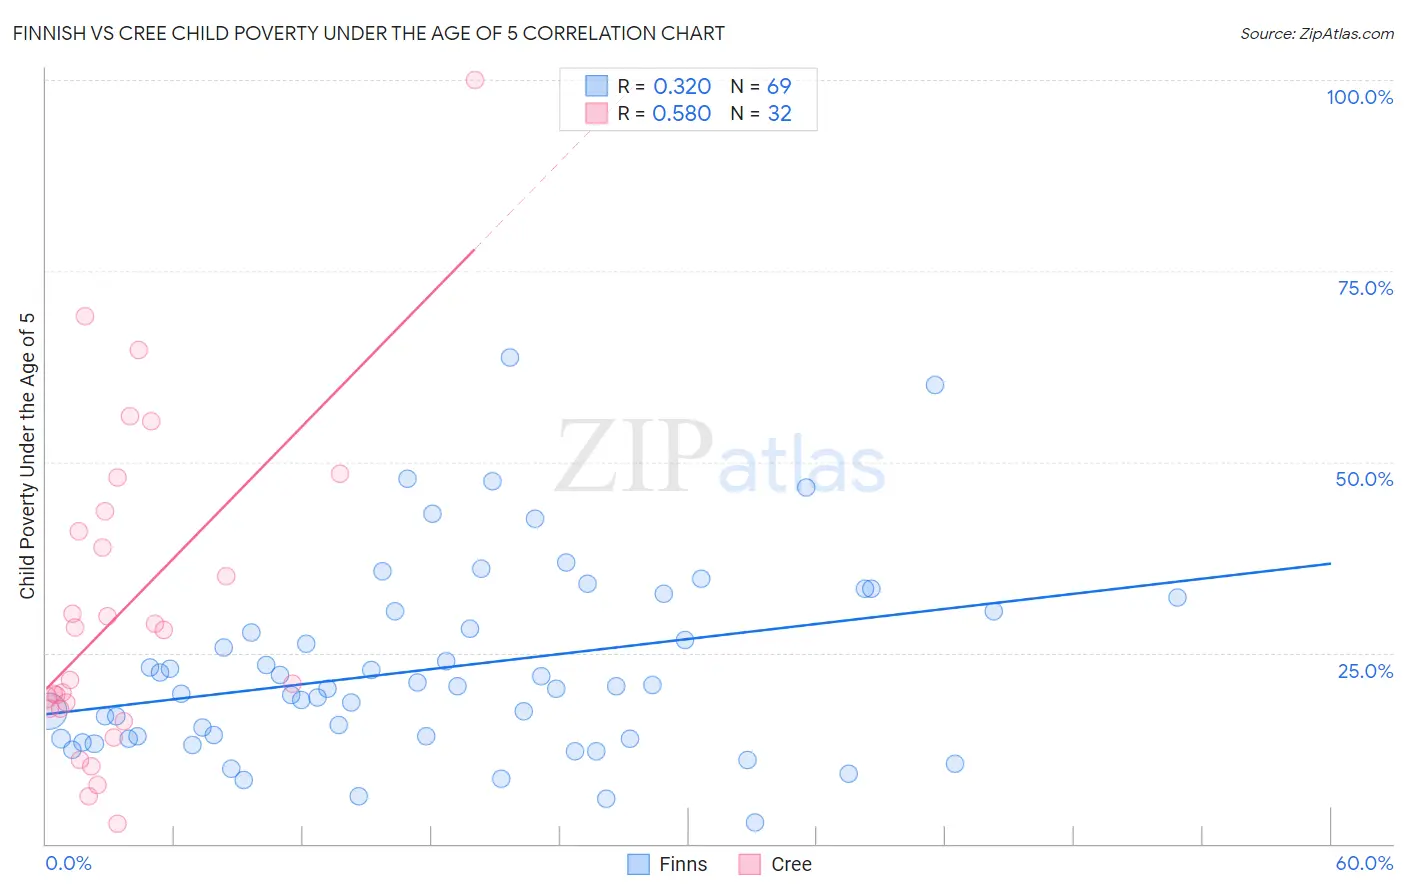
Finnish vs Cree Child Poverty Under the Age of 5 Correlation Chart
The statistical analysis conducted on geographies consisting of 384,904,212 people shows a mild positive correlation between the proportion of Finns and poverty level among children under the age of 5 in the United States with a correlation coefficient (R) of 0.320 and weighted average of 16.3%. Similarly, the statistical analysis conducted on geographies consisting of 75,401,042 people shows a substantial positive correlation between the proportion of Cree and poverty level among children under the age of 5 in the United States with a correlation coefficient (R) of 0.580 and weighted average of 19.7%, a difference of 20.6%.
Child Poverty Under the Age of 5 Correlation Summary
| Measurement | Finnish | Cree |
| Minimum | 2.8% | 2.6% |
| Maximum | 63.6% | 100.0% |
| Range | 60.8% | 97.4% |
| Mean | 23.0% | 30.8% |
| Median | 20.6% | 24.7% |
| Interquartile 25% (IQ1) | 13.8% | 17.7% |
| Interquartile 75% (IQ3) | 30.4% | 42.2% |
| Interquartile Range (IQR) | 16.6% | 24.5% |
| Standard Deviation (Sample) | 12.4% | 21.3% |
| Standard Deviation (Population) | 12.3% | 20.9% |
Similar Demographics by Child Poverty Under the Age of 5
Demographics Similar to Finns by Child Poverty Under the Age of 5
In terms of child poverty under the age of 5, the demographic groups most similar to Finns are Serbian (16.3%, a difference of 0.030%), Icelander (16.3%, a difference of 0.10%), Immigrants from North Macedonia (16.4%, a difference of 0.12%), Brazilian (16.4%, a difference of 0.13%), and Immigrants from Northern Africa (16.4%, a difference of 0.19%).
| Demographics | Rating | Rank | Child Poverty Under the Age of 5 |
| Swiss | 92.0 /100 | #124 | Exceptional 16.1% |
| Native Hawaiians | 91.8 /100 | #125 | Exceptional 16.2% |
| Immigrants | Albania | 91.8 /100 | #126 | Exceptional 16.2% |
| Immigrants | England | 91.5 /100 | #127 | Exceptional 16.2% |
| South Africans | 90.1 /100 | #128 | Exceptional 16.2% |
| British | 89.4 /100 | #129 | Excellent 16.3% |
| Immigrants | Norway | 89.3 /100 | #130 | Excellent 16.3% |
| Finns | 88.3 /100 | #131 | Excellent 16.3% |
| Serbians | 88.2 /100 | #132 | Excellent 16.3% |
| Icelanders | 87.9 /100 | #133 | Excellent 16.3% |
| Immigrants | North Macedonia | 87.8 /100 | #134 | Excellent 16.4% |
| Brazilians | 87.8 /100 | #135 | Excellent 16.4% |
| Immigrants | Northern Africa | 87.5 /100 | #136 | Excellent 16.4% |
| Immigrants | Chile | 85.3 /100 | #137 | Excellent 16.4% |
| Germans | 84.8 /100 | #138 | Excellent 16.5% |
Demographics Similar to Cree by Child Poverty Under the Age of 5
In terms of child poverty under the age of 5, the demographic groups most similar to Cree are Immigrants from Western Africa (19.7%, a difference of 0.070%), Guyanese (19.7%, a difference of 0.16%), Marshallese (19.7%, a difference of 0.17%), Immigrants from Middle Africa (19.7%, a difference of 0.19%), and Nonimmigrants (19.7%, a difference of 0.24%).
| Demographics | Rating | Rank | Child Poverty Under the Age of 5 |
| Vietnamese | 0.6 /100 | #239 | Tragic 19.5% |
| Immigrants | Ecuador | 0.5 /100 | #240 | Tragic 19.6% |
| Alaska Natives | 0.5 /100 | #241 | Tragic 19.6% |
| Immigrants | Guyana | 0.5 /100 | #242 | Tragic 19.6% |
| Osage | 0.5 /100 | #243 | Tragic 19.6% |
| Immigrants | Ghana | 0.5 /100 | #244 | Tragic 19.6% |
| Immigrants | Western Africa | 0.4 /100 | #245 | Tragic 19.7% |
| Cree | 0.4 /100 | #246 | Tragic 19.7% |
| Guyanese | 0.4 /100 | #247 | Tragic 19.7% |
| Marshallese | 0.4 /100 | #248 | Tragic 19.7% |
| Immigrants | Middle Africa | 0.4 /100 | #249 | Tragic 19.7% |
| Immigrants | Nonimmigrants | 0.4 /100 | #250 | Tragic 19.7% |
| Pennsylvania Germans | 0.3 /100 | #251 | Tragic 19.8% |
| Immigrants | Nicaragua | 0.3 /100 | #252 | Tragic 19.8% |
| Mexican American Indians | 0.3 /100 | #253 | Tragic 19.9% |