Cheyenne vs Immigrants from Greece Single Father Poverty
COMPARE
Cheyenne
Immigrants from Greece
Single Father Poverty
Single Father Poverty Comparison
Cheyenne
Immigrants from Greece
16.7%
SINGLE FATHER POVERTY
9.3/ 100
METRIC RATING
217th/ 347
METRIC RANK
16.7%
SINGLE FATHER POVERTY
8.1/ 100
METRIC RATING
221st/ 347
METRIC RANK
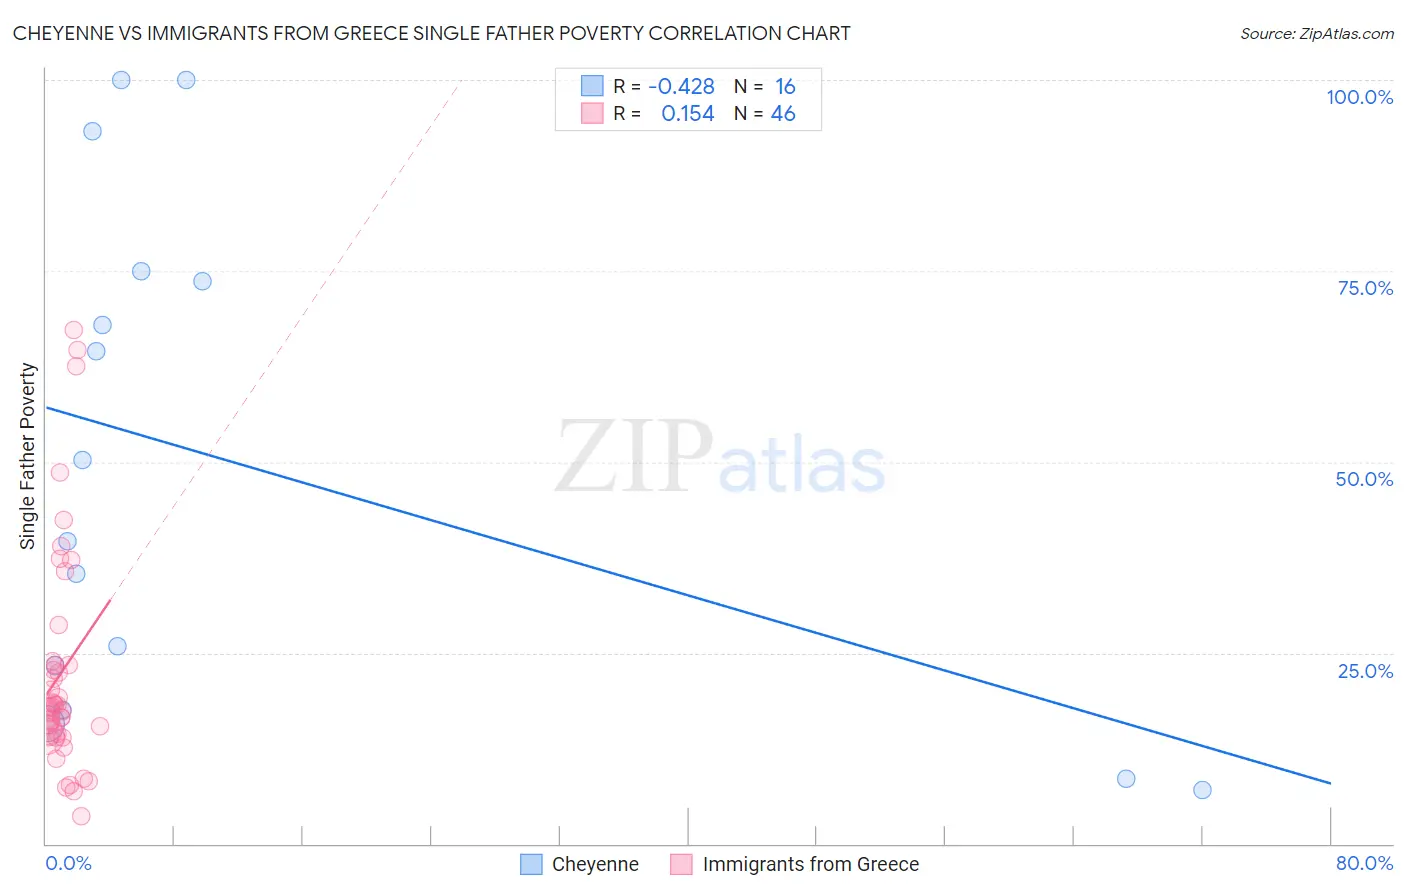
Cheyenne vs Immigrants from Greece Single Father Poverty Correlation Chart
The statistical analysis conducted on geographies consisting of 74,941,961 people shows a moderate negative correlation between the proportion of Cheyenne and poverty level among single fathers in the United States with a correlation coefficient (R) of -0.428 and weighted average of 16.7%. Similarly, the statistical analysis conducted on geographies consisting of 176,789,916 people shows a poor positive correlation between the proportion of Immigrants from Greece and poverty level among single fathers in the United States with a correlation coefficient (R) of 0.154 and weighted average of 16.7%, a difference of 0.17%.
Single Father Poverty Correlation Summary
| Measurement | Cheyenne | Immigrants from Greece |
| Minimum | 7.0% | 3.6% |
| Maximum | 100.0% | 67.2% |
| Range | 93.0% | 63.7% |
| Mean | 49.9% | 22.4% |
| Median | 45.0% | 18.0% |
| Interquartile 25% (IQ1) | 20.4% | 14.1% |
| Interquartile 75% (IQ3) | 74.3% | 23.4% |
| Interquartile Range (IQR) | 53.9% | 9.4% |
| Standard Deviation (Sample) | 32.7% | 14.8% |
| Standard Deviation (Population) | 31.6% | 14.7% |
Demographics Similar to Cheyenne and Immigrants from Greece by Single Father Poverty
In terms of single father poverty, the demographic groups most similar to Cheyenne are Immigrants from Scotland (16.7%, a difference of 0.030%), Immigrants from England (16.7%, a difference of 0.030%), Immigrants from Uganda (16.7%, a difference of 0.10%), Immigrants from Ghana (16.7%, a difference of 0.16%), and Spanish (16.7%, a difference of 0.17%). Similarly, the demographic groups most similar to Immigrants from Greece are Immigrants from Denmark (16.7%, a difference of 0.0%), Immigrants from Ghana (16.7%, a difference of 0.010%), Immigrants from Spain (16.7%, a difference of 0.010%), Immigrants from Uganda (16.7%, a difference of 0.070%), and Immigrants from Austria (16.8%, a difference of 0.17%).
| Demographics | Rating | Rank | Single Father Poverty |
| Europeans | 13.2 /100 | #209 | Poor 16.6% |
| Guatemalans | 12.9 /100 | #210 | Poor 16.6% |
| Arabs | 12.8 /100 | #211 | Poor 16.6% |
| Immigrants | Southern Europe | 11.2 /100 | #212 | Poor 16.7% |
| Ghanaians | 11.0 /100 | #213 | Poor 16.7% |
| Spanish | 10.7 /100 | #214 | Poor 16.7% |
| Immigrants | Scotland | 9.6 /100 | #215 | Tragic 16.7% |
| Immigrants | England | 9.5 /100 | #216 | Tragic 16.7% |
| Cheyenne | 9.3 /100 | #217 | Tragic 16.7% |
| Immigrants | Uganda | 8.6 /100 | #218 | Tragic 16.7% |
| Immigrants | Ghana | 8.1 /100 | #219 | Tragic 16.7% |
| Immigrants | Denmark | 8.1 /100 | #220 | Tragic 16.7% |
| Immigrants | Greece | 8.1 /100 | #221 | Tragic 16.7% |
| Immigrants | Spain | 8.0 /100 | #222 | Tragic 16.7% |
| Immigrants | Austria | 7.0 /100 | #223 | Tragic 16.8% |
| Immigrants | Norway | 6.5 /100 | #224 | Tragic 16.8% |
| Menominee | 6.4 /100 | #225 | Tragic 16.8% |
| Hispanics or Latinos | 6.1 /100 | #226 | Tragic 16.8% |
| British | 5.6 /100 | #227 | Tragic 16.8% |
| Belgians | 5.3 /100 | #228 | Tragic 16.8% |
| Israelis | 4.6 /100 | #229 | Tragic 16.8% |