Colombian vs Zimbabwean Single Father Poverty
COMPARE
Colombian
Zimbabwean
Single Father Poverty
Single Father Poverty Comparison
Colombians
Zimbabweans
16.1%
SINGLE FATHER POVERTY
77.1/ 100
METRIC RATING
147th/ 347
METRIC RANK
15.6%
SINGLE FATHER POVERTY
98.1/ 100
METRIC RATING
98th/ 347
METRIC RANK
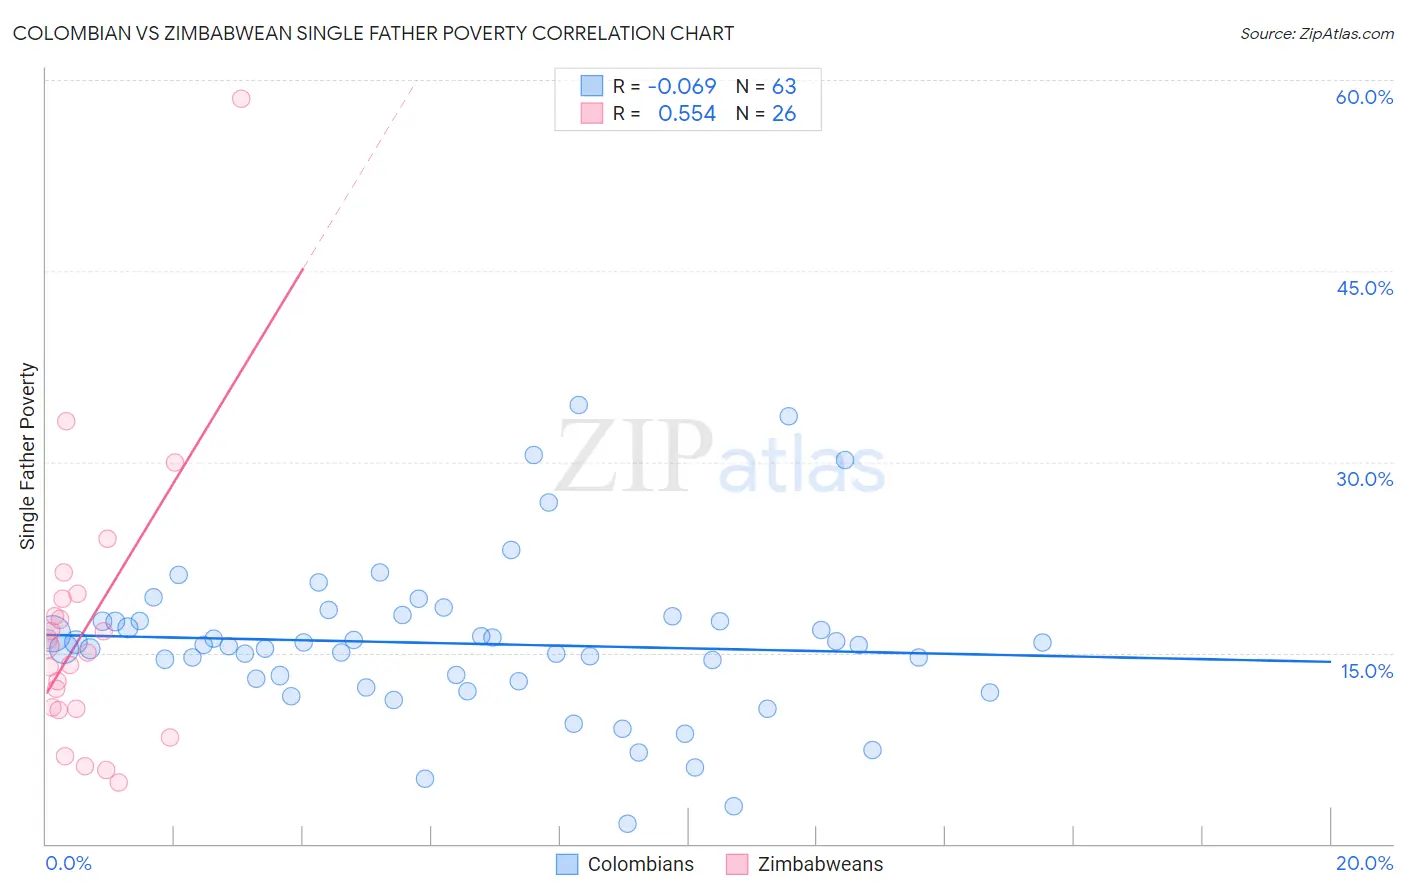
Colombian vs Zimbabwean Single Father Poverty Correlation Chart
The statistical analysis conducted on geographies consisting of 329,050,963 people shows a slight negative correlation between the proportion of Colombians and poverty level among single fathers in the United States with a correlation coefficient (R) of -0.069 and weighted average of 16.1%. Similarly, the statistical analysis conducted on geographies consisting of 64,763,564 people shows a substantial positive correlation between the proportion of Zimbabweans and poverty level among single fathers in the United States with a correlation coefficient (R) of 0.554 and weighted average of 15.6%, a difference of 3.2%.
Single Father Poverty Correlation Summary
| Measurement | Colombian | Zimbabwean |
| Minimum | 1.6% | 4.8% |
| Maximum | 34.5% | 58.6% |
| Range | 32.9% | 53.8% |
| Mean | 15.7% | 16.8% |
| Median | 15.6% | 15.3% |
| Interquartile 25% (IQ1) | 12.8% | 10.6% |
| Interquartile 75% (IQ3) | 17.5% | 19.3% |
| Interquartile Range (IQR) | 4.7% | 8.7% |
| Standard Deviation (Sample) | 6.2% | 11.0% |
| Standard Deviation (Population) | 6.2% | 10.7% |
Similar Demographics by Single Father Poverty
Demographics Similar to Colombians by Single Father Poverty
In terms of single father poverty, the demographic groups most similar to Colombians are Nigerian (16.1%, a difference of 0.020%), Immigrants from Hungary (16.1%, a difference of 0.080%), South African (16.1%, a difference of 0.12%), Jordanian (16.1%, a difference of 0.18%), and Immigrants from Western Asia (16.0%, a difference of 0.24%).
| Demographics | Rating | Rank | Single Father Poverty |
| Immigrants | Netherlands | 85.3 /100 | #140 | Excellent 16.0% |
| Liberians | 83.3 /100 | #141 | Excellent 16.0% |
| Immigrants | Mexico | 83.3 /100 | #142 | Excellent 16.0% |
| Immigrants | Central America | 83.1 /100 | #143 | Excellent 16.0% |
| Immigrants | Kuwait | 81.4 /100 | #144 | Excellent 16.0% |
| Immigrants | Western Asia | 80.7 /100 | #145 | Excellent 16.0% |
| Immigrants | Hungary | 78.3 /100 | #146 | Good 16.1% |
| Colombians | 77.1 /100 | #147 | Good 16.1% |
| Nigerians | 76.8 /100 | #148 | Good 16.1% |
| South Africans | 75.1 /100 | #149 | Good 16.1% |
| Jordanians | 74.2 /100 | #150 | Good 16.1% |
| Immigrants | France | 73.1 /100 | #151 | Good 16.1% |
| Immigrants | Zimbabwe | 72.1 /100 | #152 | Good 16.1% |
| Immigrants | Israel | 72.0 /100 | #153 | Good 16.1% |
| Mexicans | 70.1 /100 | #154 | Good 16.1% |
Demographics Similar to Zimbabweans by Single Father Poverty
In terms of single father poverty, the demographic groups most similar to Zimbabweans are Yaqui (15.6%, a difference of 0.010%), Immigrants from Belgium (15.6%, a difference of 0.020%), Immigrants from Kazakhstan (15.6%, a difference of 0.030%), Immigrants from Uruguay (15.6%, a difference of 0.080%), and Basque (15.5%, a difference of 0.22%).
| Demographics | Rating | Rank | Single Father Poverty |
| Immigrants | Romania | 98.6 /100 | #91 | Exceptional 15.5% |
| Immigrants | Serbia | 98.5 /100 | #92 | Exceptional 15.5% |
| Basques | 98.4 /100 | #93 | Exceptional 15.5% |
| Immigrants | Uruguay | 98.2 /100 | #94 | Exceptional 15.6% |
| Immigrants | Kazakhstan | 98.2 /100 | #95 | Exceptional 15.6% |
| Immigrants | Belgium | 98.1 /100 | #96 | Exceptional 15.6% |
| Yaqui | 98.1 /100 | #97 | Exceptional 15.6% |
| Zimbabweans | 98.1 /100 | #98 | Exceptional 15.6% |
| Immigrants | Middle Africa | 97.4 /100 | #99 | Exceptional 15.6% |
| Immigrants | Chile | 96.9 /100 | #100 | Exceptional 15.7% |
| Fijians | 96.8 /100 | #101 | Exceptional 15.7% |
| Chileans | 96.4 /100 | #102 | Exceptional 15.7% |
| South American Indians | 96.2 /100 | #103 | Exceptional 15.7% |
| Australians | 96.1 /100 | #104 | Exceptional 15.7% |
| Immigrants | Australia | 96.1 /100 | #105 | Exceptional 15.7% |