Colombian vs Alaskan Athabascan Male Poverty
COMPARE
Colombian
Alaskan Athabascan
Male Poverty
Male Poverty Comparison
Colombians
Alaskan Athabascans
11.0%
MALE POVERTY
63.0/ 100
METRIC RATING
158th/ 347
METRIC RANK
12.8%
MALE POVERTY
0.3/ 100
METRIC RATING
243rd/ 347
METRIC RANK
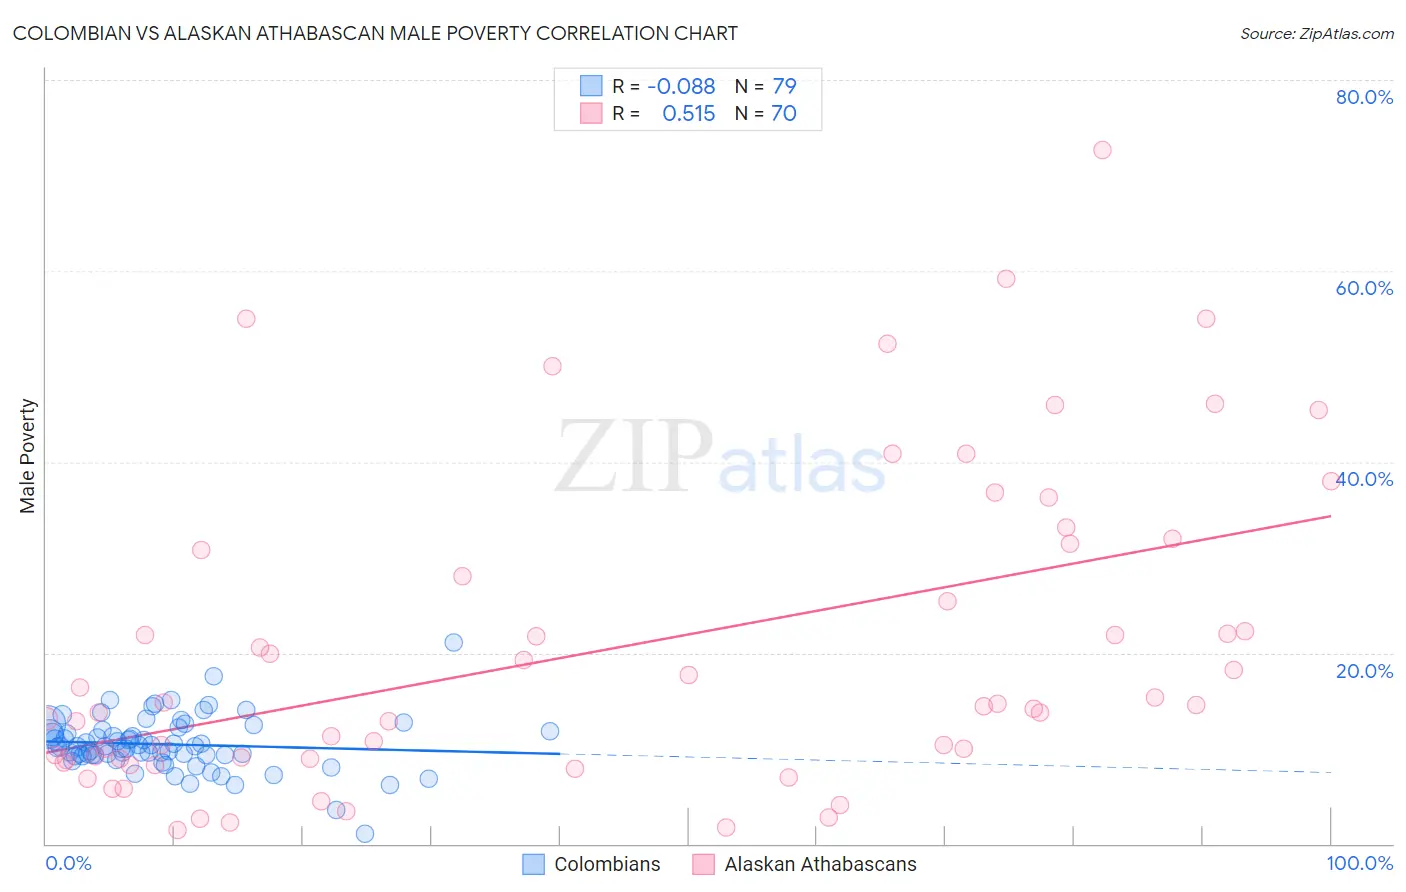
Colombian vs Alaskan Athabascan Male Poverty Correlation Chart
The statistical analysis conducted on geographies consisting of 419,146,336 people shows a slight negative correlation between the proportion of Colombians and poverty level among males in the United States with a correlation coefficient (R) of -0.088 and weighted average of 11.0%. Similarly, the statistical analysis conducted on geographies consisting of 45,812,962 people shows a substantial positive correlation between the proportion of Alaskan Athabascans and poverty level among males in the United States with a correlation coefficient (R) of 0.515 and weighted average of 12.8%, a difference of 15.8%.
Male Poverty Correlation Summary
| Measurement | Colombian | Alaskan Athabascan |
| Minimum | 1.0% | 1.4% |
| Maximum | 21.0% | 72.7% |
| Range | 20.0% | 71.3% |
| Mean | 10.4% | 20.4% |
| Median | 10.2% | 14.5% |
| Interquartile 25% (IQ1) | 9.2% | 8.9% |
| Interquartile 75% (IQ3) | 11.8% | 30.8% |
| Interquartile Range (IQR) | 2.5% | 22.0% |
| Standard Deviation (Sample) | 2.9% | 16.4% |
| Standard Deviation (Population) | 2.9% | 16.2% |
Similar Demographics by Male Poverty
Demographics Similar to Colombians by Male Poverty
In terms of male poverty, the demographic groups most similar to Colombians are Taiwanese (11.0%, a difference of 0.030%), Scotch-Irish (11.0%, a difference of 0.080%), Costa Rican (11.0%, a difference of 0.10%), Immigrants from Malaysia (11.0%, a difference of 0.19%), and Immigrants from Kazakhstan (11.0%, a difference of 0.20%).
| Demographics | Rating | Rank | Male Poverty |
| Venezuelans | 67.4 /100 | #151 | Good 11.0% |
| Immigrants | Nepal | 67.3 /100 | #152 | Good 11.0% |
| Immigrants | Bosnia and Herzegovina | 65.2 /100 | #153 | Good 11.0% |
| Immigrants | Kazakhstan | 64.8 /100 | #154 | Good 11.0% |
| Immigrants | Malaysia | 64.7 /100 | #155 | Good 11.0% |
| Costa Ricans | 63.9 /100 | #156 | Good 11.0% |
| Scotch-Irish | 63.7 /100 | #157 | Good 11.0% |
| Colombians | 63.0 /100 | #158 | Good 11.0% |
| Taiwanese | 62.7 /100 | #159 | Good 11.0% |
| Soviet Union | 60.3 /100 | #160 | Good 11.1% |
| Immigrants | Northern Africa | 59.7 /100 | #161 | Average 11.1% |
| Immigrants | Chile | 57.4 /100 | #162 | Average 11.1% |
| Whites/Caucasians | 56.7 /100 | #163 | Average 11.1% |
| Ethiopians | 56.7 /100 | #164 | Average 11.1% |
| Immigrants | Spain | 55.5 /100 | #165 | Average 11.1% |
Demographics Similar to Alaskan Athabascans by Male Poverty
In terms of male poverty, the demographic groups most similar to Alaskan Athabascans are Nepalese (12.8%, a difference of 0.040%), Tsimshian (12.8%, a difference of 0.11%), Liberian (12.8%, a difference of 0.12%), Sudanese (12.8%, a difference of 0.20%), and Immigrants from El Salvador (12.8%, a difference of 0.42%).
| Demographics | Rating | Rank | Male Poverty |
| Immigrants | Saudi Arabia | 0.4 /100 | #236 | Tragic 12.7% |
| French American Indians | 0.4 /100 | #237 | Tragic 12.7% |
| Ecuadorians | 0.4 /100 | #238 | Tragic 12.7% |
| Ghanaians | 0.4 /100 | #239 | Tragic 12.7% |
| Immigrants | Middle Africa | 0.4 /100 | #240 | Tragic 12.7% |
| Sudanese | 0.3 /100 | #241 | Tragic 12.8% |
| Nepalese | 0.3 /100 | #242 | Tragic 12.8% |
| Alaskan Athabascans | 0.3 /100 | #243 | Tragic 12.8% |
| Tsimshian | 0.3 /100 | #244 | Tragic 12.8% |
| Liberians | 0.3 /100 | #245 | Tragic 12.8% |
| Immigrants | El Salvador | 0.2 /100 | #246 | Tragic 12.8% |
| Immigrants | Western Africa | 0.2 /100 | #247 | Tragic 12.9% |
| Immigrants | Sudan | 0.2 /100 | #248 | Tragic 12.9% |
| Potawatomi | 0.2 /100 | #249 | Tragic 12.9% |
| Immigrants | Nicaragua | 0.2 /100 | #250 | Tragic 12.9% |