Chippewa vs Slavic Child Poverty Under the Age of 5
COMPARE
Chippewa
Slavic
Child Poverty Under the Age of 5
Child Poverty Under the Age of 5 Comparison
Chippewa
Slavs
23.4%
CHILD POVERTY UNDER THE AGE OF 5
0.0/ 100
METRIC RATING
319th/ 347
METRIC RANK
17.0%
CHILD POVERTY UNDER THE AGE OF 5
64.0/ 100
METRIC RATING
166th/ 347
METRIC RANK
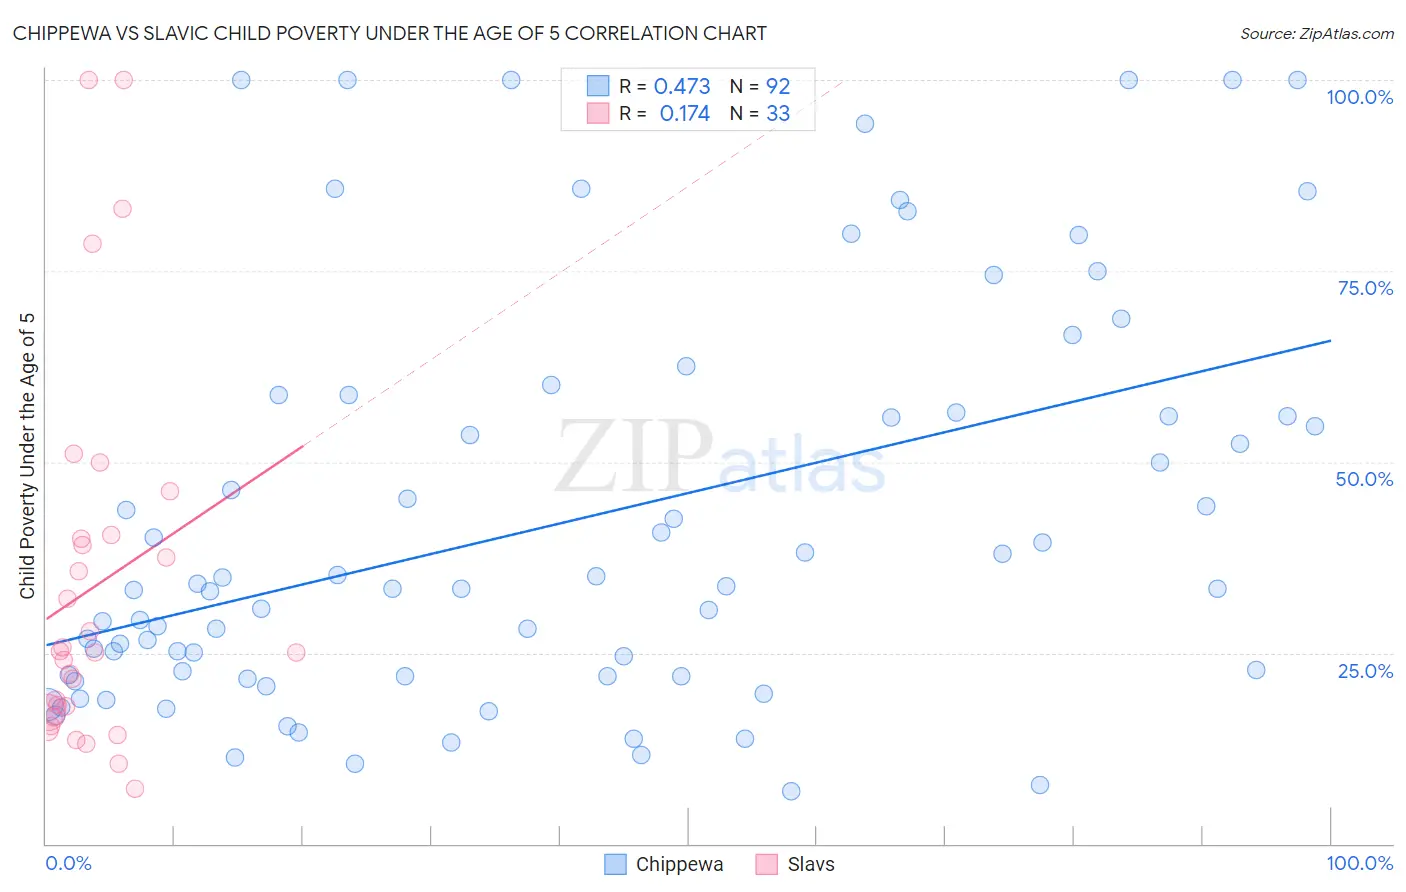
Chippewa vs Slavic Child Poverty Under the Age of 5 Correlation Chart
The statistical analysis conducted on geographies consisting of 210,183,643 people shows a moderate positive correlation between the proportion of Chippewa and poverty level among children under the age of 5 in the United States with a correlation coefficient (R) of 0.473 and weighted average of 23.4%. Similarly, the statistical analysis conducted on geographies consisting of 261,045,487 people shows a poor positive correlation between the proportion of Slavs and poverty level among children under the age of 5 in the United States with a correlation coefficient (R) of 0.174 and weighted average of 17.0%, a difference of 37.8%.
Child Poverty Under the Age of 5 Correlation Summary
| Measurement | Chippewa | Slavic |
| Minimum | 6.9% | 7.2% |
| Maximum | 100.0% | 100.0% |
| Range | 93.1% | 92.8% |
| Mean | 42.0% | 33.6% |
| Median | 33.3% | 25.0% |
| Interquartile 25% (IQ1) | 22.0% | 16.9% |
| Interquartile 75% (IQ3) | 56.2% | 40.2% |
| Interquartile Range (IQR) | 34.2% | 23.3% |
| Standard Deviation (Sample) | 26.2% | 24.5% |
| Standard Deviation (Population) | 26.0% | 24.1% |
Similar Demographics by Child Poverty Under the Age of 5
Demographics Similar to Chippewa by Child Poverty Under the Age of 5
In terms of child poverty under the age of 5, the demographic groups most similar to Chippewa are Choctaw (23.5%, a difference of 0.38%), Immigrants from Honduras (23.5%, a difference of 0.41%), Dutch West Indian (23.3%, a difference of 0.48%), Menominee (23.3%, a difference of 0.58%), and Ute (23.5%, a difference of 0.64%).
| Demographics | Rating | Rank | Child Poverty Under the Age of 5 |
| Hondurans | 0.0 /100 | #312 | Tragic 23.0% |
| Bahamians | 0.0 /100 | #313 | Tragic 23.0% |
| U.S. Virgin Islanders | 0.0 /100 | #314 | Tragic 23.0% |
| Arapaho | 0.0 /100 | #315 | Tragic 23.1% |
| Yakama | 0.0 /100 | #316 | Tragic 23.1% |
| Menominee | 0.0 /100 | #317 | Tragic 23.3% |
| Dutch West Indians | 0.0 /100 | #318 | Tragic 23.3% |
| Chippewa | 0.0 /100 | #319 | Tragic 23.4% |
| Choctaw | 0.0 /100 | #320 | Tragic 23.5% |
| Immigrants | Honduras | 0.0 /100 | #321 | Tragic 23.5% |
| Ute | 0.0 /100 | #322 | Tragic 23.5% |
| Pueblo | 0.0 /100 | #323 | Tragic 23.7% |
| Paiute | 0.0 /100 | #324 | Tragic 23.8% |
| Immigrants | Congo | 0.0 /100 | #325 | Tragic 23.9% |
| Central American Indians | 0.0 /100 | #326 | Tragic 23.9% |
Demographics Similar to Slavs by Child Poverty Under the Age of 5
In terms of child poverty under the age of 5, the demographic groups most similar to Slavs are Immigrants from Uzbekistan (17.0%, a difference of 0.22%), Immigrants from Colombia (16.9%, a difference of 0.34%), Uruguayan (17.0%, a difference of 0.39%), Immigrants from Oceania (16.9%, a difference of 0.43%), and Immigrants from South America (17.1%, a difference of 0.44%).
| Demographics | Rating | Rank | Child Poverty Under the Age of 5 |
| Immigrants | Syria | 72.3 /100 | #159 | Good 16.8% |
| Irish | 72.0 /100 | #160 | Good 16.8% |
| English | 70.4 /100 | #161 | Good 16.8% |
| Costa Ricans | 69.8 /100 | #162 | Good 16.9% |
| Scottish | 68.6 /100 | #163 | Good 16.9% |
| Immigrants | Oceania | 67.6 /100 | #164 | Good 16.9% |
| Immigrants | Colombia | 66.9 /100 | #165 | Good 16.9% |
| Slavs | 64.0 /100 | #166 | Good 17.0% |
| Immigrants | Uzbekistan | 62.0 /100 | #167 | Good 17.0% |
| Uruguayans | 60.5 /100 | #168 | Good 17.0% |
| Immigrants | South America | 60.0 /100 | #169 | Good 17.1% |
| Immigrants | Western Asia | 59.2 /100 | #170 | Average 17.1% |
| Immigrants | Morocco | 58.9 /100 | #171 | Average 17.1% |
| Yugoslavians | 54.1 /100 | #172 | Average 17.2% |
| Welsh | 54.0 /100 | #173 | Average 17.2% |