Chilean vs Immigrants from Hungary Unemployment Among Ages 60 to 64 years
COMPARE
Chilean
Immigrants from Hungary
Unemployment Among Ages 60 to 64 years
Unemployment Among Ages 60 to 64 years Comparison
Chileans
Immigrants from Hungary
4.8%
UNEMPLOYMENT AMONG AGES 60 TO 64 YEARS
72.6/ 100
METRIC RATING
154th/ 347
METRIC RANK
4.9%
UNEMPLOYMENT AMONG AGES 60 TO 64 YEARS
50.2/ 100
METRIC RATING
173rd/ 347
METRIC RANK
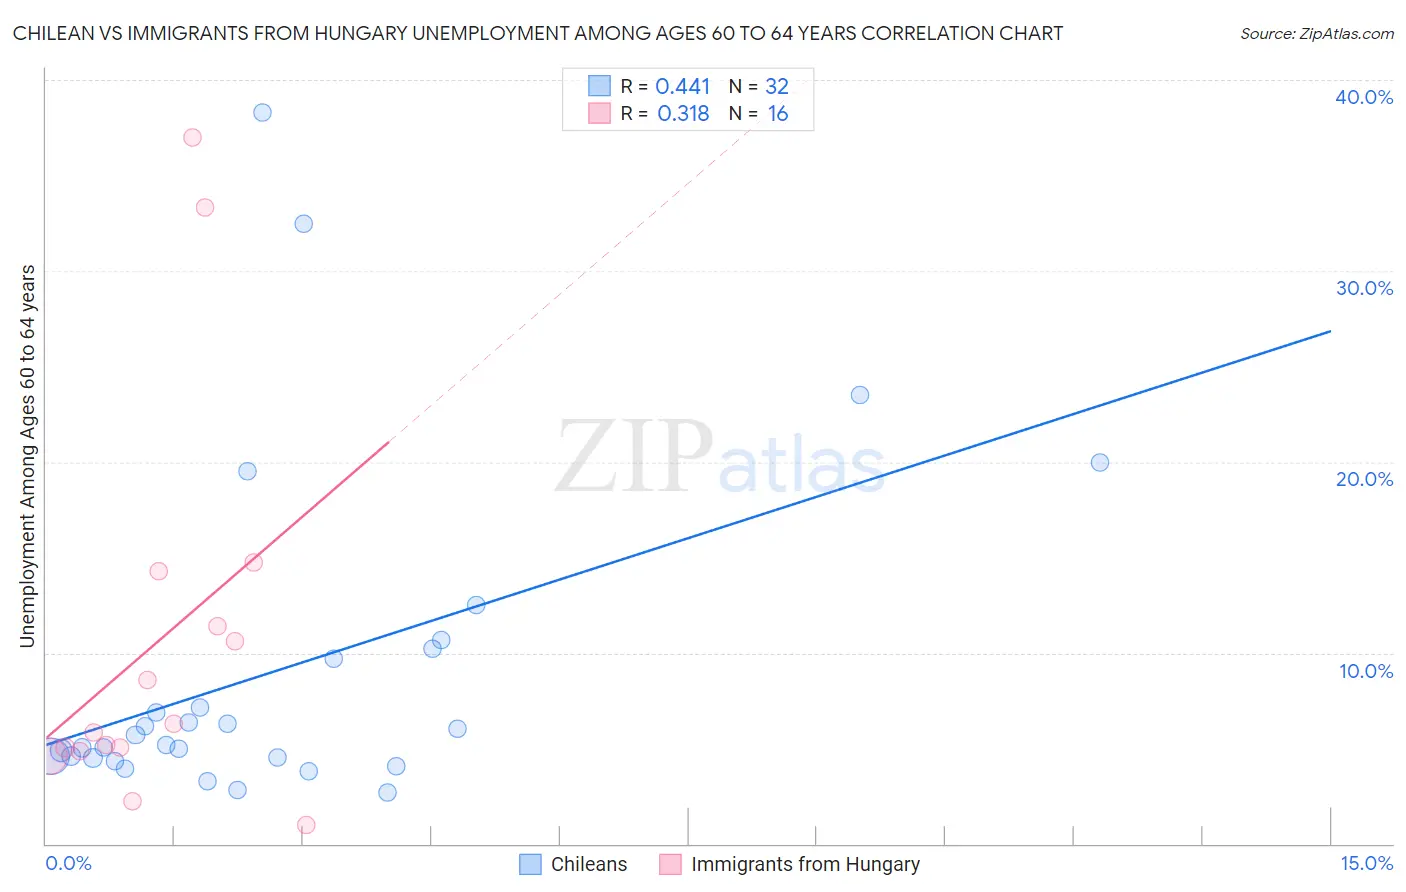
Chilean vs Immigrants from Hungary Unemployment Among Ages 60 to 64 years Correlation Chart
The statistical analysis conducted on geographies consisting of 243,499,371 people shows a moderate positive correlation between the proportion of Chileans and unemployment rate among population between the ages 60 and 64 in the United States with a correlation coefficient (R) of 0.441 and weighted average of 4.8%. Similarly, the statistical analysis conducted on geographies consisting of 186,606,017 people shows a mild positive correlation between the proportion of Immigrants from Hungary and unemployment rate among population between the ages 60 and 64 in the United States with a correlation coefficient (R) of 0.318 and weighted average of 4.9%, a difference of 0.86%.
Unemployment Among Ages 60 to 64 years Correlation Summary
| Measurement | Chilean | Immigrants from Hungary |
| Minimum | 2.7% | 1.0% |
| Maximum | 38.3% | 37.0% |
| Range | 35.6% | 36.0% |
| Mean | 9.0% | 10.6% |
| Median | 5.4% | 6.1% |
| Interquartile 25% (IQ1) | 4.5% | 4.9% |
| Interquartile 75% (IQ3) | 9.9% | 12.9% |
| Interquartile Range (IQR) | 5.5% | 7.9% |
| Standard Deviation (Sample) | 8.6% | 10.4% |
| Standard Deviation (Population) | 8.5% | 10.0% |
Demographics Similar to Chileans and Immigrants from Hungary by Unemployment Among Ages 60 to 64 years
In terms of unemployment among ages 60 to 64 years, the demographic groups most similar to Chileans are Filipino (4.8%, a difference of 0.020%), Bolivian (4.8%, a difference of 0.13%), Immigrants from Bolivia (4.8%, a difference of 0.15%), Laotian (4.8%, a difference of 0.25%), and Immigrants from Taiwan (4.8%, a difference of 0.28%). Similarly, the demographic groups most similar to Immigrants from Hungary are Immigrants from Turkey (4.9%, a difference of 0.090%), Samoan (4.9%, a difference of 0.12%), Immigrants from Korea (4.8%, a difference of 0.14%), Immigrants from France (4.8%, a difference of 0.19%), and Immigrants from Southern Europe (4.8%, a difference of 0.23%).
| Demographics | Rating | Rank | Unemployment Among Ages 60 to 64 years |
| Bolivians | 75.5 /100 | #153 | Good 4.8% |
| Chileans | 72.6 /100 | #154 | Good 4.8% |
| Filipinos | 72.1 /100 | #155 | Good 4.8% |
| Immigrants | Bolivia | 69.2 /100 | #156 | Good 4.8% |
| Laotians | 66.8 /100 | #157 | Good 4.8% |
| Immigrants | Taiwan | 66.0 /100 | #158 | Good 4.8% |
| Spanish | 65.5 /100 | #159 | Good 4.8% |
| Australians | 65.3 /100 | #160 | Good 4.8% |
| Immigrants | Norway | 65.1 /100 | #161 | Good 4.8% |
| South Africans | 65.1 /100 | #162 | Good 4.8% |
| Immigrants | Belgium | 64.8 /100 | #163 | Good 4.8% |
| Pakistanis | 64.6 /100 | #164 | Good 4.8% |
| Immigrants | Panama | 62.0 /100 | #165 | Good 4.8% |
| Palestinians | 60.5 /100 | #166 | Good 4.8% |
| Immigrants | Northern Europe | 59.1 /100 | #167 | Average 4.8% |
| Immigrants | Southern Europe | 56.7 /100 | #168 | Average 4.8% |
| Immigrants | France | 55.5 /100 | #169 | Average 4.8% |
| Immigrants | Korea | 54.2 /100 | #170 | Average 4.8% |
| Samoans | 53.6 /100 | #171 | Average 4.9% |
| Immigrants | Turkey | 52.8 /100 | #172 | Average 4.9% |
| Immigrants | Hungary | 50.2 /100 | #173 | Average 4.9% |