Chickasaw vs Lebanese Female Poverty Among 25-34 Year Olds
COMPARE
Chickasaw
Lebanese
Female Poverty Among 25-34 Year Olds
Female Poverty Among 25-34 Year Olds Comparison
Chickasaw
Lebanese
17.0%
FEMALE POVERTY AMONG 25-34 YEAR OLDS
0.0/ 100
METRIC RATING
306th/ 347
METRIC RANK
13.2%
FEMALE POVERTY AMONG 25-34 YEAR OLDS
76.8/ 100
METRIC RATING
148th/ 347
METRIC RANK
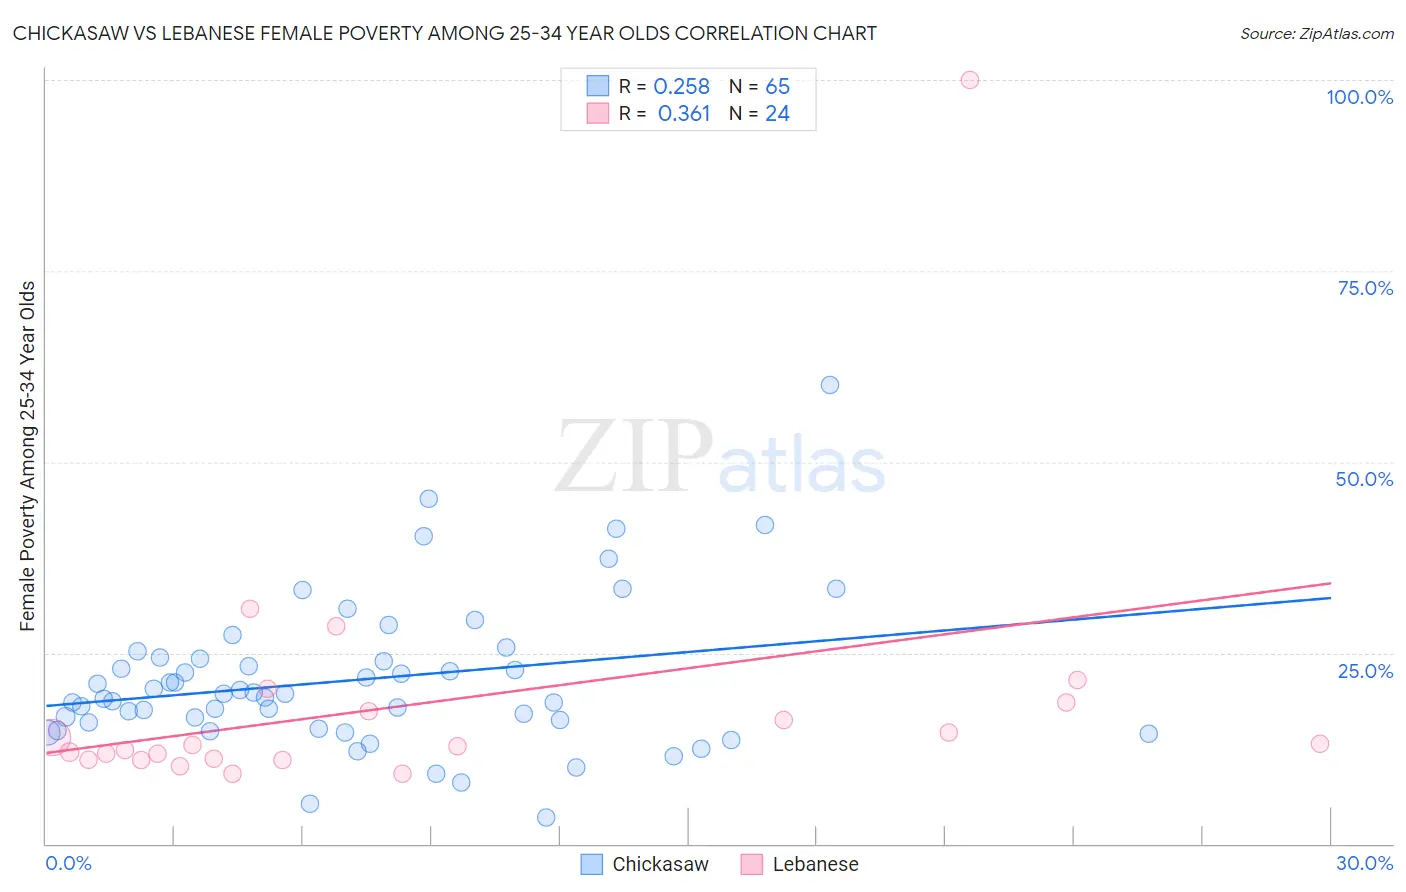
Chickasaw vs Lebanese Female Poverty Among 25-34 Year Olds Correlation Chart
The statistical analysis conducted on geographies consisting of 147,041,279 people shows a weak positive correlation between the proportion of Chickasaw and poverty level among females between the ages 25 and 34 in the United States with a correlation coefficient (R) of 0.258 and weighted average of 17.0%. Similarly, the statistical analysis conducted on geographies consisting of 394,015,177 people shows a mild positive correlation between the proportion of Lebanese and poverty level among females between the ages 25 and 34 in the United States with a correlation coefficient (R) of 0.361 and weighted average of 13.2%, a difference of 28.9%.
Female Poverty Among 25-34 Year Olds Correlation Summary
| Measurement | Chickasaw | Lebanese |
| Minimum | 3.5% | 9.2% |
| Maximum | 60.0% | 100.0% |
| Range | 56.5% | 90.8% |
| Mean | 21.5% | 18.4% |
| Median | 19.7% | 12.9% |
| Interquartile 25% (IQ1) | 15.5% | 11.0% |
| Interquartile 75% (IQ3) | 24.3% | 17.9% |
| Interquartile Range (IQR) | 8.8% | 6.9% |
| Standard Deviation (Sample) | 9.8% | 18.3% |
| Standard Deviation (Population) | 9.7% | 17.9% |
Similar Demographics by Female Poverty Among 25-34 Year Olds
Demographics Similar to Chickasaw by Female Poverty Among 25-34 Year Olds
In terms of female poverty among 25-34 year olds, the demographic groups most similar to Chickasaw are Yaqui (17.0%, a difference of 0.020%), African (17.0%, a difference of 0.22%), Ottawa (17.1%, a difference of 0.52%), Immigrants from Cabo Verde (16.9%, a difference of 0.58%), and Honduran (16.9%, a difference of 0.75%).
| Demographics | Rating | Rank | Female Poverty Among 25-34 Year Olds |
| Spanish Americans | 0.0 /100 | #299 | Tragic 16.7% |
| U.S. Virgin Islanders | 0.0 /100 | #300 | Tragic 16.7% |
| Immigrants | Congo | 0.0 /100 | #301 | Tragic 16.7% |
| Alaska Natives | 0.0 /100 | #302 | Tragic 16.8% |
| Immigrants | Mexico | 0.0 /100 | #303 | Tragic 16.8% |
| Hondurans | 0.0 /100 | #304 | Tragic 16.9% |
| Immigrants | Cabo Verde | 0.0 /100 | #305 | Tragic 16.9% |
| Chickasaw | 0.0 /100 | #306 | Tragic 17.0% |
| Yaqui | 0.0 /100 | #307 | Tragic 17.0% |
| Africans | 0.0 /100 | #308 | Tragic 17.0% |
| Ottawa | 0.0 /100 | #309 | Tragic 17.1% |
| Cherokee | 0.0 /100 | #310 | Tragic 17.2% |
| Immigrants | Honduras | 0.0 /100 | #311 | Tragic 17.3% |
| Iroquois | 0.0 /100 | #312 | Tragic 17.5% |
| Colville | 0.0 /100 | #313 | Tragic 17.5% |
Demographics Similar to Lebanese by Female Poverty Among 25-34 Year Olds
In terms of female poverty among 25-34 year olds, the demographic groups most similar to Lebanese are European (13.2%, a difference of 0.0%), South American (13.2%, a difference of 0.010%), Colombian (13.2%, a difference of 0.050%), Sierra Leonean (13.2%, a difference of 0.060%), and Iraqi (13.2%, a difference of 0.090%).
| Demographics | Rating | Rank | Female Poverty Among 25-34 Year Olds |
| New Zealanders | 83.4 /100 | #141 | Excellent 13.1% |
| Scandinavians | 82.3 /100 | #142 | Excellent 13.1% |
| Israelis | 81.9 /100 | #143 | Excellent 13.1% |
| Native Hawaiians | 78.9 /100 | #144 | Good 13.2% |
| Colombians | 77.2 /100 | #145 | Good 13.2% |
| South Americans | 76.9 /100 | #146 | Good 13.2% |
| Europeans | 76.8 /100 | #147 | Good 13.2% |
| Lebanese | 76.8 /100 | #148 | Good 13.2% |
| Sierra Leoneans | 76.3 /100 | #149 | Good 13.2% |
| Iraqis | 76.0 /100 | #150 | Good 13.2% |
| Costa Ricans | 75.8 /100 | #151 | Good 13.2% |
| Slavs | 75.7 /100 | #152 | Good 13.2% |
| Northern Europeans | 73.7 /100 | #153 | Good 13.2% |
| Arabs | 73.5 /100 | #154 | Good 13.2% |
| Immigrants | Sierra Leone | 72.9 /100 | #155 | Good 13.3% |