Black/African American vs Lebanese Female Poverty Among 25-34 Year Olds
COMPARE
Black/African American
Lebanese
Female Poverty Among 25-34 Year Olds
Female Poverty Among 25-34 Year Olds Comparison
Blacks/African Americans
Lebanese
18.9%
FEMALE POVERTY AMONG 25-34 YEAR OLDS
0.0/ 100
METRIC RATING
326th/ 347
METRIC RANK
13.2%
FEMALE POVERTY AMONG 25-34 YEAR OLDS
76.8/ 100
METRIC RATING
148th/ 347
METRIC RANK
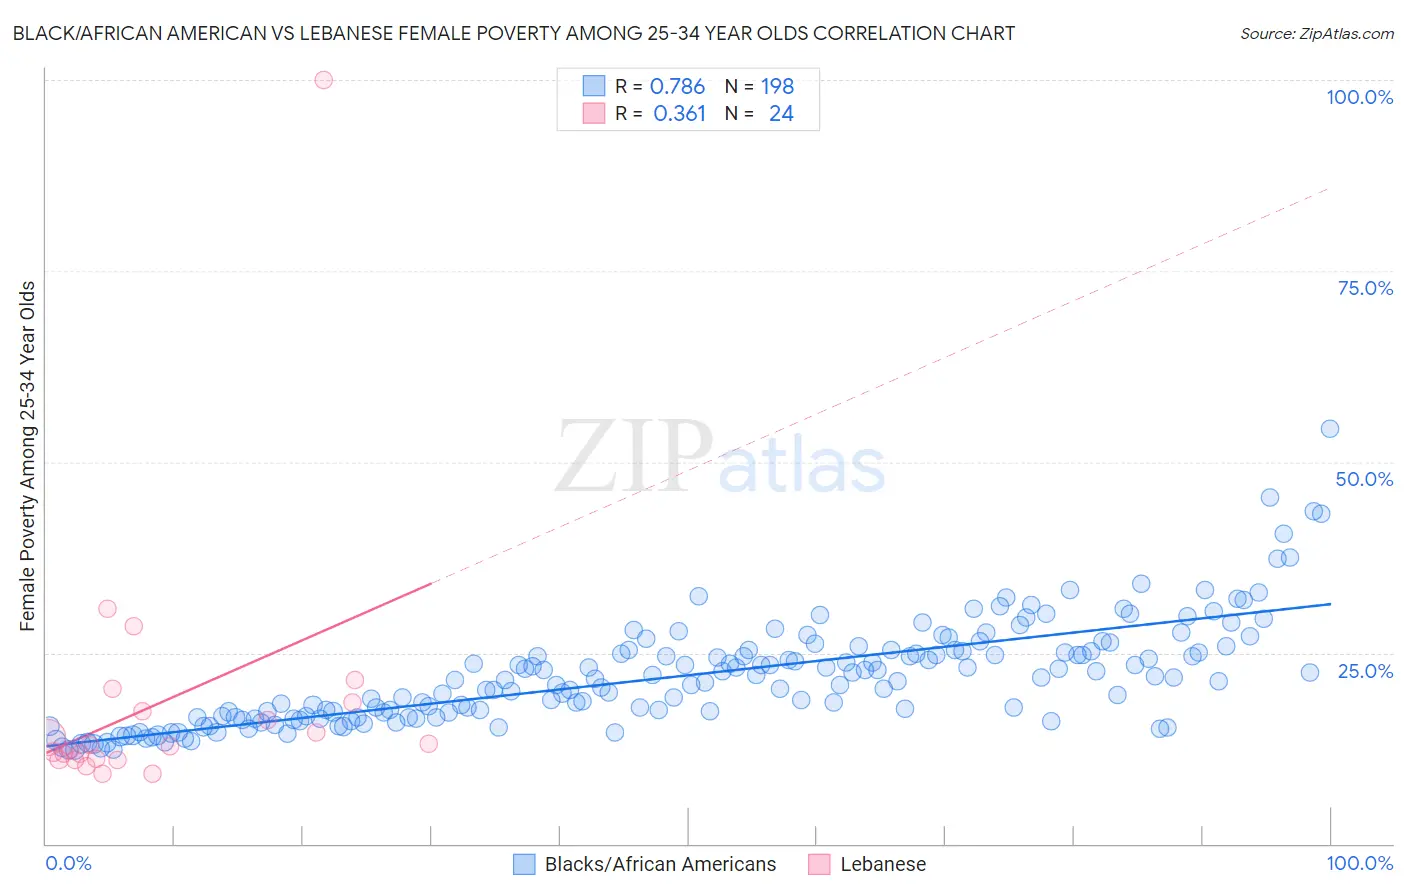
Black/African American vs Lebanese Female Poverty Among 25-34 Year Olds Correlation Chart
The statistical analysis conducted on geographies consisting of 547,087,054 people shows a strong positive correlation between the proportion of Blacks/African Americans and poverty level among females between the ages 25 and 34 in the United States with a correlation coefficient (R) of 0.786 and weighted average of 18.9%. Similarly, the statistical analysis conducted on geographies consisting of 394,015,177 people shows a mild positive correlation between the proportion of Lebanese and poverty level among females between the ages 25 and 34 in the United States with a correlation coefficient (R) of 0.361 and weighted average of 13.2%, a difference of 43.3%.
Female Poverty Among 25-34 Year Olds Correlation Summary
| Measurement | Black/African American | Lebanese |
| Minimum | 12.3% | 9.2% |
| Maximum | 54.3% | 100.0% |
| Range | 42.0% | 90.8% |
| Mean | 22.0% | 18.4% |
| Median | 21.4% | 12.9% |
| Interquartile 25% (IQ1) | 16.5% | 11.0% |
| Interquartile 75% (IQ3) | 25.2% | 17.9% |
| Interquartile Range (IQR) | 8.7% | 6.9% |
| Standard Deviation (Sample) | 6.8% | 18.3% |
| Standard Deviation (Population) | 6.8% | 17.9% |
Similar Demographics by Female Poverty Among 25-34 Year Olds
Demographics Similar to Blacks/African Americans by Female Poverty Among 25-34 Year Olds
In terms of female poverty among 25-34 year olds, the demographic groups most similar to Blacks/African Americans are Cheyenne (19.1%, a difference of 0.96%), Alaskan Athabascan (19.1%, a difference of 1.0%), Creek (19.2%, a difference of 1.3%), Inupiat (18.5%, a difference of 2.0%), and Dutch West Indian (18.4%, a difference of 2.6%).
| Demographics | Rating | Rank | Female Poverty Among 25-34 Year Olds |
| Menominee | 0.0 /100 | #319 | Tragic 18.0% |
| Chippewa | 0.0 /100 | #320 | Tragic 18.0% |
| Choctaw | 0.0 /100 | #321 | Tragic 18.1% |
| Central American Indians | 0.0 /100 | #322 | Tragic 18.2% |
| Seminole | 0.0 /100 | #323 | Tragic 18.3% |
| Dutch West Indians | 0.0 /100 | #324 | Tragic 18.4% |
| Inupiat | 0.0 /100 | #325 | Tragic 18.5% |
| Blacks/African Americans | 0.0 /100 | #326 | Tragic 18.9% |
| Cheyenne | 0.0 /100 | #327 | Tragic 19.1% |
| Alaskan Athabascans | 0.0 /100 | #328 | Tragic 19.1% |
| Creek | 0.0 /100 | #329 | Tragic 19.2% |
| Paiute | 0.0 /100 | #330 | Tragic 19.6% |
| Kiowa | 0.0 /100 | #331 | Tragic 19.7% |
| Immigrants | Yemen | 0.0 /100 | #332 | Tragic 19.8% |
| Cajuns | 0.0 /100 | #333 | Tragic 19.9% |
Demographics Similar to Lebanese by Female Poverty Among 25-34 Year Olds
In terms of female poverty among 25-34 year olds, the demographic groups most similar to Lebanese are European (13.2%, a difference of 0.0%), South American (13.2%, a difference of 0.010%), Colombian (13.2%, a difference of 0.050%), Sierra Leonean (13.2%, a difference of 0.060%), and Iraqi (13.2%, a difference of 0.090%).
| Demographics | Rating | Rank | Female Poverty Among 25-34 Year Olds |
| New Zealanders | 83.4 /100 | #141 | Excellent 13.1% |
| Scandinavians | 82.3 /100 | #142 | Excellent 13.1% |
| Israelis | 81.9 /100 | #143 | Excellent 13.1% |
| Native Hawaiians | 78.9 /100 | #144 | Good 13.2% |
| Colombians | 77.2 /100 | #145 | Good 13.2% |
| South Americans | 76.9 /100 | #146 | Good 13.2% |
| Europeans | 76.8 /100 | #147 | Good 13.2% |
| Lebanese | 76.8 /100 | #148 | Good 13.2% |
| Sierra Leoneans | 76.3 /100 | #149 | Good 13.2% |
| Iraqis | 76.0 /100 | #150 | Good 13.2% |
| Costa Ricans | 75.8 /100 | #151 | Good 13.2% |
| Slavs | 75.7 /100 | #152 | Good 13.2% |
| Northern Europeans | 73.7 /100 | #153 | Good 13.2% |
| Arabs | 73.5 /100 | #154 | Good 13.2% |
| Immigrants | Sierra Leone | 72.9 /100 | #155 | Good 13.3% |