Chickasaw vs Immigrants from Poland Female Poverty Among 25-34 Year Olds
COMPARE
Chickasaw
Immigrants from Poland
Female Poverty Among 25-34 Year Olds
Female Poverty Among 25-34 Year Olds Comparison
Chickasaw
Immigrants from Poland
17.0%
FEMALE POVERTY AMONG 25-34 YEAR OLDS
0.0/ 100
METRIC RATING
306th/ 347
METRIC RANK
11.6%
FEMALE POVERTY AMONG 25-34 YEAR OLDS
99.9/ 100
METRIC RATING
33rd/ 347
METRIC RANK
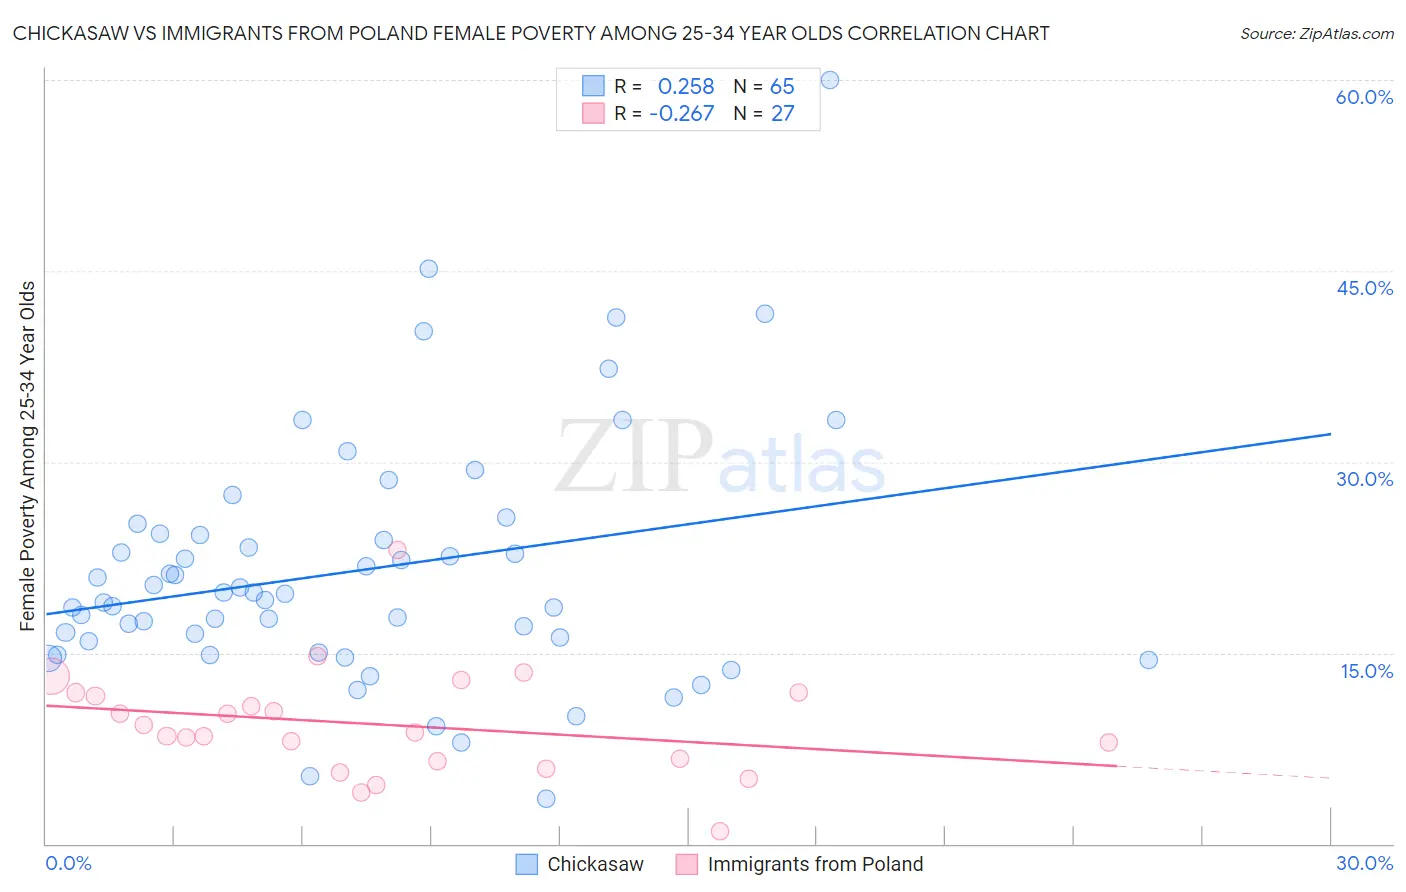
Chickasaw vs Immigrants from Poland Female Poverty Among 25-34 Year Olds Correlation Chart
The statistical analysis conducted on geographies consisting of 147,041,279 people shows a weak positive correlation between the proportion of Chickasaw and poverty level among females between the ages 25 and 34 in the United States with a correlation coefficient (R) of 0.258 and weighted average of 17.0%. Similarly, the statistical analysis conducted on geographies consisting of 299,264,805 people shows a weak negative correlation between the proportion of Immigrants from Poland and poverty level among females between the ages 25 and 34 in the United States with a correlation coefficient (R) of -0.267 and weighted average of 11.6%, a difference of 46.2%.
Female Poverty Among 25-34 Year Olds Correlation Summary
| Measurement | Chickasaw | Immigrants from Poland |
| Minimum | 3.5% | 0.98% |
| Maximum | 60.0% | 23.1% |
| Range | 56.5% | 22.1% |
| Mean | 21.5% | 9.4% |
| Median | 19.7% | 8.8% |
| Interquartile 25% (IQ1) | 15.5% | 6.5% |
| Interquartile 75% (IQ3) | 24.3% | 11.8% |
| Interquartile Range (IQR) | 8.8% | 5.4% |
| Standard Deviation (Sample) | 9.8% | 4.3% |
| Standard Deviation (Population) | 9.7% | 4.2% |
Similar Demographics by Female Poverty Among 25-34 Year Olds
Demographics Similar to Chickasaw by Female Poverty Among 25-34 Year Olds
In terms of female poverty among 25-34 year olds, the demographic groups most similar to Chickasaw are Yaqui (17.0%, a difference of 0.020%), African (17.0%, a difference of 0.22%), Ottawa (17.1%, a difference of 0.52%), Immigrants from Cabo Verde (16.9%, a difference of 0.58%), and Honduran (16.9%, a difference of 0.75%).
| Demographics | Rating | Rank | Female Poverty Among 25-34 Year Olds |
| Spanish Americans | 0.0 /100 | #299 | Tragic 16.7% |
| U.S. Virgin Islanders | 0.0 /100 | #300 | Tragic 16.7% |
| Immigrants | Congo | 0.0 /100 | #301 | Tragic 16.7% |
| Alaska Natives | 0.0 /100 | #302 | Tragic 16.8% |
| Immigrants | Mexico | 0.0 /100 | #303 | Tragic 16.8% |
| Hondurans | 0.0 /100 | #304 | Tragic 16.9% |
| Immigrants | Cabo Verde | 0.0 /100 | #305 | Tragic 16.9% |
| Chickasaw | 0.0 /100 | #306 | Tragic 17.0% |
| Yaqui | 0.0 /100 | #307 | Tragic 17.0% |
| Africans | 0.0 /100 | #308 | Tragic 17.0% |
| Ottawa | 0.0 /100 | #309 | Tragic 17.1% |
| Cherokee | 0.0 /100 | #310 | Tragic 17.2% |
| Immigrants | Honduras | 0.0 /100 | #311 | Tragic 17.3% |
| Iroquois | 0.0 /100 | #312 | Tragic 17.5% |
| Colville | 0.0 /100 | #313 | Tragic 17.5% |
Demographics Similar to Immigrants from Poland by Female Poverty Among 25-34 Year Olds
In terms of female poverty among 25-34 year olds, the demographic groups most similar to Immigrants from Poland are Zimbabwean (11.7%, a difference of 0.22%), Immigrants from Asia (11.6%, a difference of 0.35%), Cambodian (11.7%, a difference of 0.49%), Immigrants from Japan (11.6%, a difference of 0.65%), and Cypriot (11.5%, a difference of 0.94%).
| Demographics | Rating | Rank | Female Poverty Among 25-34 Year Olds |
| Tongans | 99.9 /100 | #26 | Exceptional 11.5% |
| Immigrants | Greece | 99.9 /100 | #27 | Exceptional 11.5% |
| Immigrants | Pakistan | 99.9 /100 | #28 | Exceptional 11.5% |
| Bulgarians | 99.9 /100 | #29 | Exceptional 11.5% |
| Cypriots | 99.9 /100 | #30 | Exceptional 11.5% |
| Immigrants | Japan | 99.9 /100 | #31 | Exceptional 11.6% |
| Immigrants | Asia | 99.9 /100 | #32 | Exceptional 11.6% |
| Immigrants | Poland | 99.9 /100 | #33 | Exceptional 11.6% |
| Zimbabweans | 99.9 /100 | #34 | Exceptional 11.7% |
| Cambodians | 99.9 /100 | #35 | Exceptional 11.7% |
| Immigrants | Sri Lanka | 99.8 /100 | #36 | Exceptional 11.8% |
| Taiwanese | 99.8 /100 | #37 | Exceptional 11.8% |
| Immigrants | North Macedonia | 99.8 /100 | #38 | Exceptional 11.8% |
| Latvians | 99.8 /100 | #39 | Exceptional 11.8% |
| Immigrants | Bulgaria | 99.8 /100 | #40 | Exceptional 11.8% |