White/Caucasian vs Immigrants from Fiji Child Poverty Under the Age of 16
COMPARE
White/Caucasian
Immigrants from Fiji
Child Poverty Under the Age of 16
Child Poverty Under the Age of 16 Comparison
Whites/Caucasians
Immigrants from Fiji
16.2%
CHILD POVERTY UNDER THE AGE OF 16
50.0/ 100
METRIC RATING
174th/ 347
METRIC RANK
15.8%
CHILD POVERTY UNDER THE AGE OF 16
71.1/ 100
METRIC RATING
159th/ 347
METRIC RANK
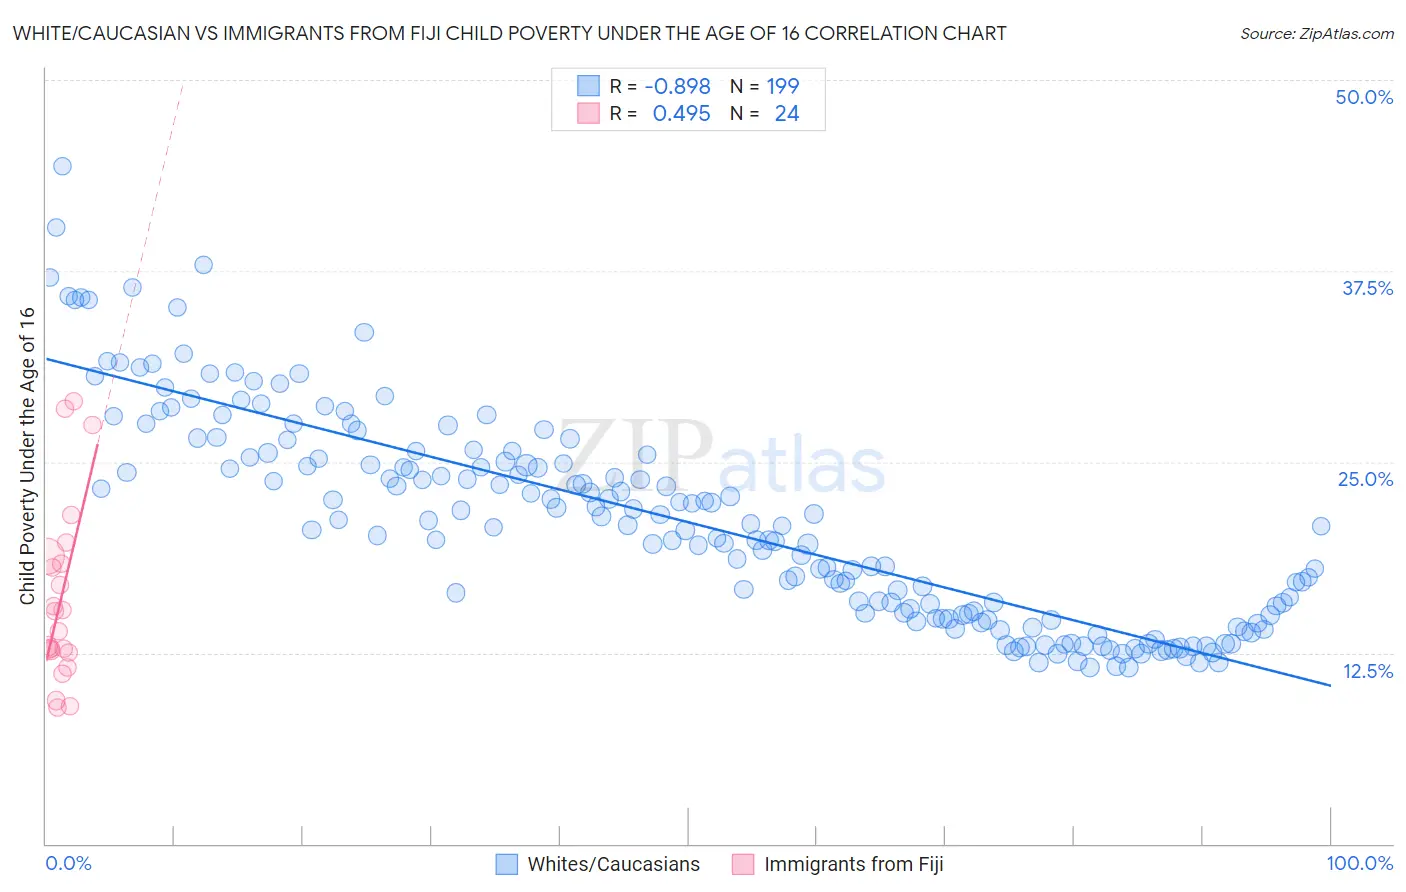
White/Caucasian vs Immigrants from Fiji Child Poverty Under the Age of 16 Correlation Chart
The statistical analysis conducted on geographies consisting of 568,969,283 people shows a very strong negative correlation between the proportion of Whites/Caucasians and poverty level among children under the age of 16 in the United States with a correlation coefficient (R) of -0.898 and weighted average of 16.2%. Similarly, the statistical analysis conducted on geographies consisting of 93,637,524 people shows a moderate positive correlation between the proportion of Immigrants from Fiji and poverty level among children under the age of 16 in the United States with a correlation coefficient (R) of 0.495 and weighted average of 15.8%, a difference of 2.8%.
Child Poverty Under the Age of 16 Correlation Summary
| Measurement | White/Caucasian | Immigrants from Fiji |
| Minimum | 11.5% | 8.9% |
| Maximum | 44.4% | 28.9% |
| Range | 32.8% | 20.0% |
| Mean | 21.1% | 16.0% |
| Median | 20.8% | 14.5% |
| Interquartile 25% (IQ1) | 15.0% | 12.6% |
| Interquartile 75% (IQ3) | 25.3% | 18.6% |
| Interquartile Range (IQR) | 10.4% | 6.0% |
| Standard Deviation (Sample) | 6.9% | 5.8% |
| Standard Deviation (Population) | 6.8% | 5.7% |
Demographics Similar to Whites/Caucasians and Immigrants from Fiji by Child Poverty Under the Age of 16
In terms of child poverty under the age of 16, the demographic groups most similar to Whites/Caucasians are Immigrants from Saudi Arabia (16.2%, a difference of 0.25%), Afghan (16.2%, a difference of 0.27%), Hungarian (16.2%, a difference of 0.30%), Scotch-Irish (16.3%, a difference of 0.34%), and Lebanese (16.3%, a difference of 0.50%). Similarly, the demographic groups most similar to Immigrants from Fiji are Immigrants from Albania (15.8%, a difference of 0.070%), Immigrants from Chile (15.7%, a difference of 0.26%), Immigrants from Nepal (15.7%, a difference of 0.27%), Immigrants from Northern Africa (15.8%, a difference of 0.45%), and Colombian (15.8%, a difference of 0.51%).
| Demographics | Rating | Rank | Child Poverty Under the Age of 16 |
| Immigrants | Venezuela | 74.9 /100 | #156 | Good 15.7% |
| Immigrants | Nepal | 72.9 /100 | #157 | Good 15.7% |
| Immigrants | Chile | 72.8 /100 | #158 | Good 15.7% |
| Immigrants | Fiji | 71.1 /100 | #159 | Good 15.8% |
| Immigrants | Albania | 70.7 /100 | #160 | Good 15.8% |
| Immigrants | Northern Africa | 68.1 /100 | #161 | Good 15.8% |
| Colombians | 67.6 /100 | #162 | Good 15.8% |
| Yugoslavians | 67.6 /100 | #163 | Good 15.8% |
| Immigrants | Germany | 67.3 /100 | #164 | Good 15.8% |
| Guamanians/Chamorros | 66.4 /100 | #165 | Good 15.9% |
| Immigrants | Oceania | 65.4 /100 | #166 | Good 15.9% |
| Costa Ricans | 61.1 /100 | #167 | Good 16.0% |
| South Americans | 57.9 /100 | #168 | Average 16.0% |
| Uruguayans | 54.7 /100 | #169 | Average 16.1% |
| Immigrants | Colombia | 54.4 /100 | #170 | Average 16.1% |
| Hungarians | 52.5 /100 | #171 | Average 16.2% |
| Afghans | 52.3 /100 | #172 | Average 16.2% |
| Immigrants | Saudi Arabia | 52.1 /100 | #173 | Average 16.2% |
| Whites/Caucasians | 50.0 /100 | #174 | Average 16.2% |
| Scotch-Irish | 47.1 /100 | #175 | Average 16.3% |
| Lebanese | 45.9 /100 | #176 | Average 16.3% |