Hungarian vs Central American Indian Female Poverty Among 18-24 Year Olds
COMPARE
Hungarian
Central American Indian
Female Poverty Among 18-24 Year Olds
Female Poverty Among 18-24 Year Olds Comparison
Hungarians
Central American Indians
19.8%
FEMALE POVERTY AMONG 18-24 YEAR OLDS
76.6/ 100
METRIC RATING
155th/ 347
METRIC RANK
22.6%
FEMALE POVERTY AMONG 18-24 YEAR OLDS
0.0/ 100
METRIC RATING
298th/ 347
METRIC RANK
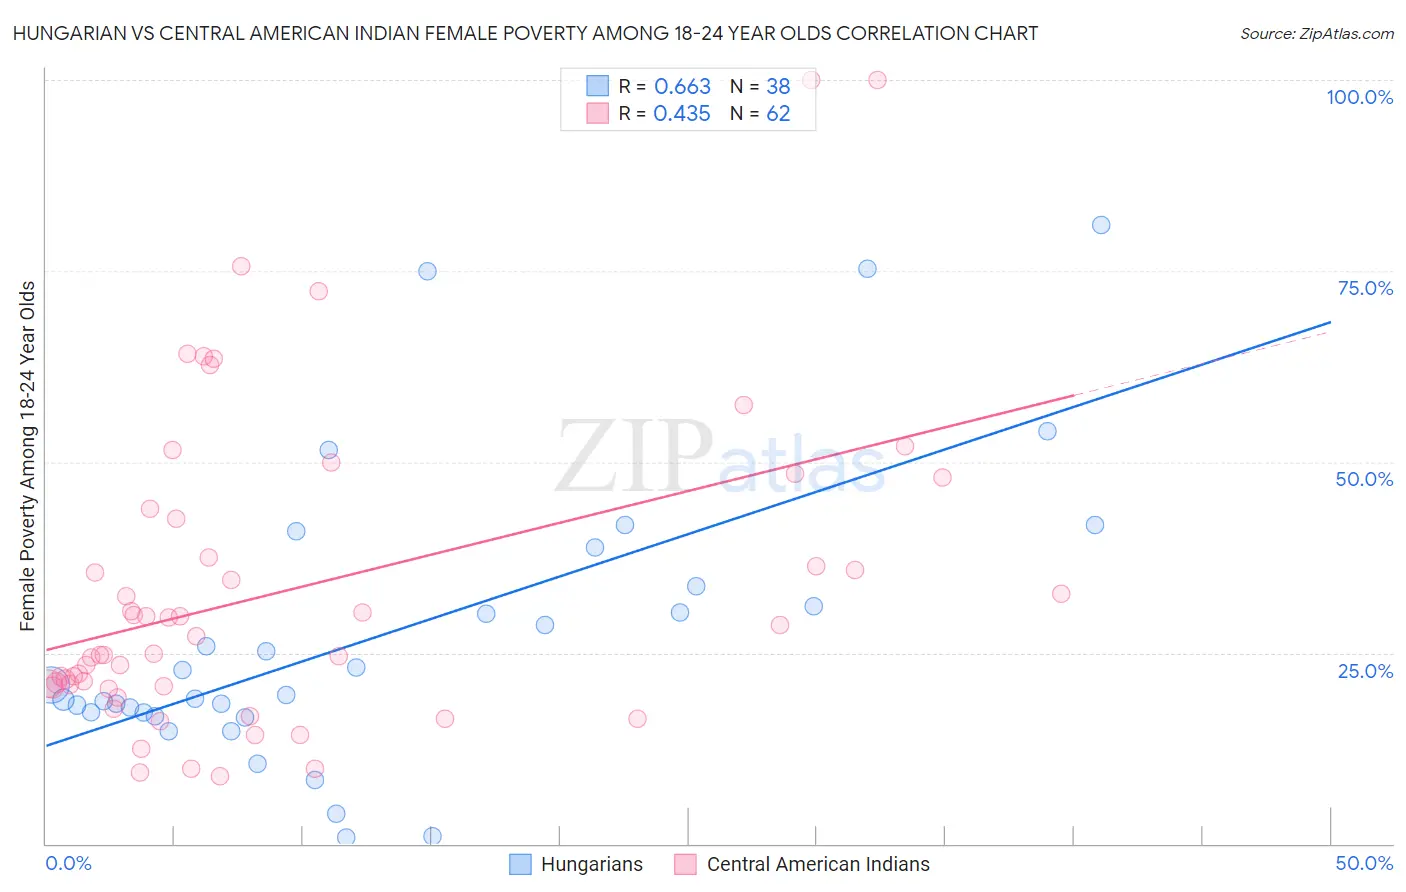
Hungarian vs Central American Indian Female Poverty Among 18-24 Year Olds Correlation Chart
The statistical analysis conducted on geographies consisting of 465,185,254 people shows a significant positive correlation between the proportion of Hungarians and poverty level among females between the ages 18 and 24 in the United States with a correlation coefficient (R) of 0.663 and weighted average of 19.8%. Similarly, the statistical analysis conducted on geographies consisting of 322,009,816 people shows a moderate positive correlation between the proportion of Central American Indians and poverty level among females between the ages 18 and 24 in the United States with a correlation coefficient (R) of 0.435 and weighted average of 22.6%, a difference of 14.0%.
Female Poverty Among 18-24 Year Olds Correlation Summary
| Measurement | Hungarian | Central American Indian |
| Minimum | 0.77% | 8.8% |
| Maximum | 81.0% | 100.0% |
| Range | 80.3% | 91.2% |
| Mean | 27.4% | 33.2% |
| Median | 20.1% | 26.0% |
| Interquartile 25% (IQ1) | 17.1% | 20.6% |
| Interquartile 75% (IQ3) | 33.7% | 42.6% |
| Interquartile Range (IQR) | 16.5% | 22.0% |
| Standard Deviation (Sample) | 19.2% | 20.4% |
| Standard Deviation (Population) | 18.9% | 20.3% |
Similar Demographics by Female Poverty Among 18-24 Year Olds
Demographics Similar to Hungarians by Female Poverty Among 18-24 Year Olds
In terms of female poverty among 18-24 year olds, the demographic groups most similar to Hungarians are Immigrants from Zimbabwe (19.8%, a difference of 0.0%), Immigrants from Belgium (19.8%, a difference of 0.010%), Danish (19.8%, a difference of 0.070%), Immigrants from Lebanon (19.8%, a difference of 0.090%), and Immigrants from Japan (19.8%, a difference of 0.11%).
| Demographics | Rating | Rank | Female Poverty Among 18-24 Year Olds |
| Immigrants | Latin America | 81.3 /100 | #148 | Excellent 19.7% |
| Immigrants | Oceania | 81.2 /100 | #149 | Excellent 19.7% |
| Syrians | 80.2 /100 | #150 | Excellent 19.8% |
| Immigrants | Eastern Asia | 79.7 /100 | #151 | Good 19.8% |
| Yugoslavians | 79.0 /100 | #152 | Good 19.8% |
| Immigrants | Japan | 78.1 /100 | #153 | Good 19.8% |
| Immigrants | Zimbabwe | 76.7 /100 | #154 | Good 19.8% |
| Hungarians | 76.6 /100 | #155 | Good 19.8% |
| Immigrants | Belgium | 76.4 /100 | #156 | Good 19.8% |
| Danes | 75.5 /100 | #157 | Good 19.8% |
| Immigrants | Lebanon | 75.3 /100 | #158 | Good 19.8% |
| Trinidadians and Tobagonians | 74.4 /100 | #159 | Good 19.8% |
| Pakistanis | 74.1 /100 | #160 | Good 19.8% |
| Immigrants | Belize | 74.1 /100 | #161 | Good 19.8% |
| French Canadians | 73.0 /100 | #162 | Good 19.9% |
Demographics Similar to Central American Indians by Female Poverty Among 18-24 Year Olds
In terms of female poverty among 18-24 year olds, the demographic groups most similar to Central American Indians are Inupiat (22.6%, a difference of 0.070%), Menominee (22.5%, a difference of 0.21%), Shoshone (22.5%, a difference of 0.32%), Cherokee (22.7%, a difference of 0.41%), and Indonesian (22.5%, a difference of 0.44%).
| Demographics | Rating | Rank | Female Poverty Among 18-24 Year Olds |
| Bangladeshis | 0.0 /100 | #291 | Tragic 22.5% |
| Alaskan Athabascans | 0.0 /100 | #292 | Tragic 22.5% |
| U.S. Virgin Islanders | 0.0 /100 | #293 | Tragic 22.5% |
| Indonesians | 0.0 /100 | #294 | Tragic 22.5% |
| Shoshone | 0.0 /100 | #295 | Tragic 22.5% |
| Menominee | 0.0 /100 | #296 | Tragic 22.5% |
| Inupiat | 0.0 /100 | #297 | Tragic 22.6% |
| Central American Indians | 0.0 /100 | #298 | Tragic 22.6% |
| Cherokee | 0.0 /100 | #299 | Tragic 22.7% |
| Africans | 0.0 /100 | #300 | Tragic 22.8% |
| Seminole | 0.0 /100 | #301 | Tragic 22.9% |
| Iroquois | 0.0 /100 | #302 | Tragic 22.9% |
| Senegalese | 0.0 /100 | #303 | Tragic 23.0% |
| Sudanese | 0.0 /100 | #304 | Tragic 23.0% |
| Immigrants | Kuwait | 0.0 /100 | #305 | Tragic 23.0% |