Chickasaw vs European Female Poverty Among 18-24 Year Olds
COMPARE
Chickasaw
European
Female Poverty Among 18-24 Year Olds
Female Poverty Among 18-24 Year Olds Comparison
Chickasaw
Europeans
24.5%
FEMALE POVERTY AMONG 18-24 YEAR OLDS
0.0/ 100
METRIC RATING
318th/ 347
METRIC RANK
20.4%
FEMALE POVERTY AMONG 18-24 YEAR OLDS
19.9/ 100
METRIC RATING
200th/ 347
METRIC RANK
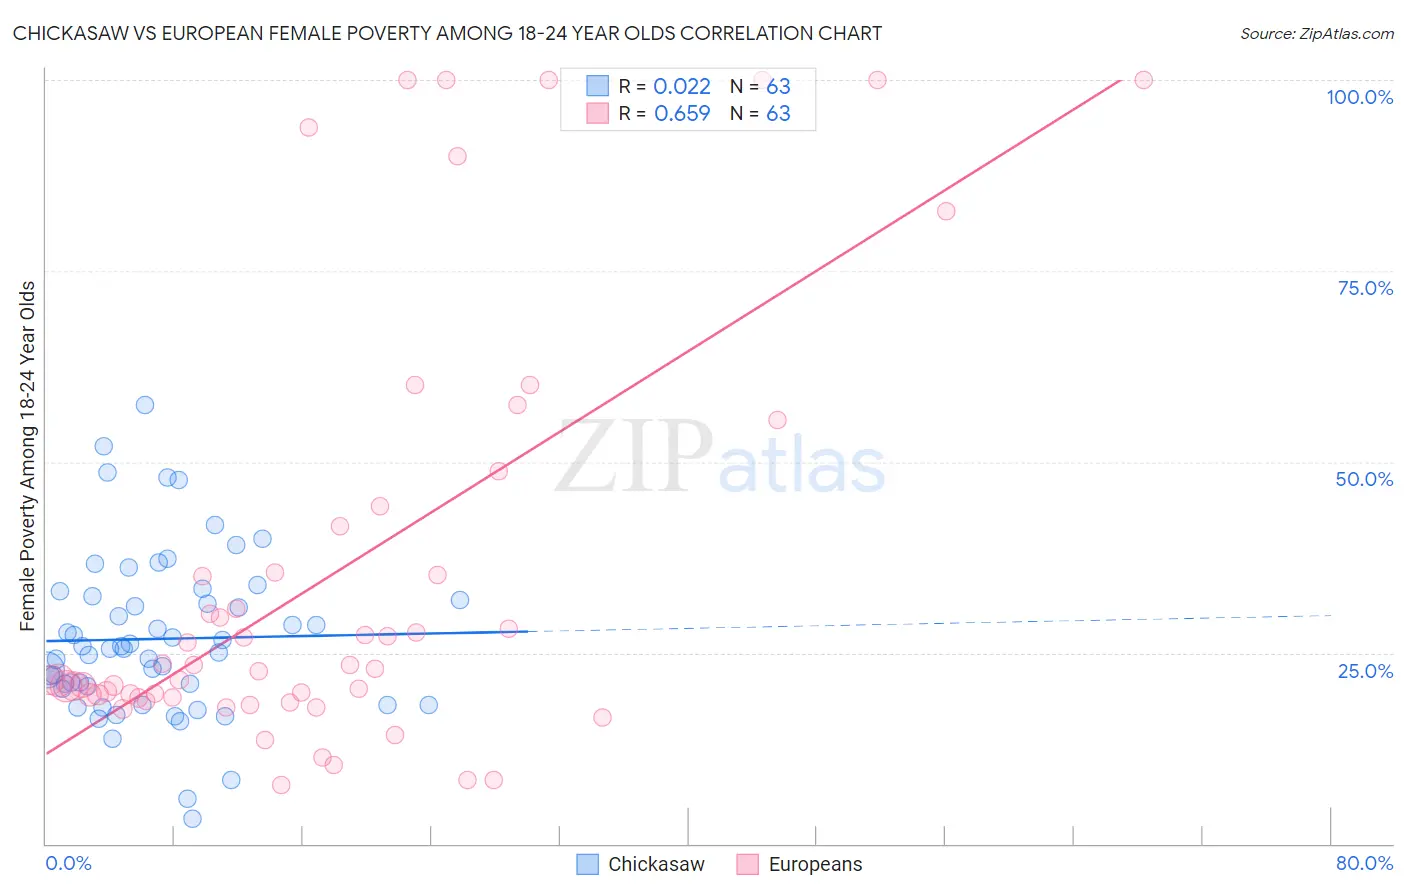
Chickasaw vs European Female Poverty Among 18-24 Year Olds Correlation Chart
The statistical analysis conducted on geographies consisting of 146,361,358 people shows no correlation between the proportion of Chickasaw and poverty level among females between the ages 18 and 24 in the United States with a correlation coefficient (R) of 0.022 and weighted average of 24.5%. Similarly, the statistical analysis conducted on geographies consisting of 530,028,341 people shows a significant positive correlation between the proportion of Europeans and poverty level among females between the ages 18 and 24 in the United States with a correlation coefficient (R) of 0.659 and weighted average of 20.4%, a difference of 19.7%.
Female Poverty Among 18-24 Year Olds Correlation Summary
| Measurement | Chickasaw | European |
| Minimum | 3.3% | 7.7% |
| Maximum | 57.4% | 100.0% |
| Range | 54.1% | 92.3% |
| Mean | 26.8% | 35.4% |
| Median | 25.6% | 22.9% |
| Interquartile 25% (IQ1) | 20.4% | 19.2% |
| Interquartile 75% (IQ3) | 32.3% | 41.6% |
| Interquartile Range (IQR) | 12.0% | 22.4% |
| Standard Deviation (Sample) | 10.6% | 27.7% |
| Standard Deviation (Population) | 10.5% | 27.5% |
Similar Demographics by Female Poverty Among 18-24 Year Olds
Demographics Similar to Chickasaw by Female Poverty Among 18-24 Year Olds
In terms of female poverty among 18-24 year olds, the demographic groups most similar to Chickasaw are Osage (24.5%, a difference of 0.090%), Dutch West Indian (24.5%, a difference of 0.10%), Alsatian (24.4%, a difference of 0.38%), Immigrants from Congo (24.6%, a difference of 0.40%), and Black/African American (24.3%, a difference of 0.69%).
| Demographics | Rating | Rank | Female Poverty Among 18-24 Year Olds |
| Potawatomi | 0.0 /100 | #311 | Tragic 23.7% |
| Yuman | 0.0 /100 | #312 | Tragic 24.0% |
| Creek | 0.0 /100 | #313 | Tragic 24.2% |
| Choctaw | 0.0 /100 | #314 | Tragic 24.3% |
| Blacks/African Americans | 0.0 /100 | #315 | Tragic 24.3% |
| Alsatians | 0.0 /100 | #316 | Tragic 24.4% |
| Osage | 0.0 /100 | #317 | Tragic 24.5% |
| Chickasaw | 0.0 /100 | #318 | Tragic 24.5% |
| Dutch West Indians | 0.0 /100 | #319 | Tragic 24.5% |
| Immigrants | Congo | 0.0 /100 | #320 | Tragic 24.6% |
| Immigrants | Zaire | 0.0 /100 | #321 | Tragic 25.1% |
| Somalis | 0.0 /100 | #322 | Tragic 25.1% |
| Arapaho | 0.0 /100 | #323 | Tragic 25.2% |
| German Russians | 0.0 /100 | #324 | Tragic 25.2% |
| Immigrants | Saudi Arabia | 0.0 /100 | #325 | Tragic 25.3% |
Demographics Similar to Europeans by Female Poverty Among 18-24 Year Olds
In terms of female poverty among 18-24 year olds, the demographic groups most similar to Europeans are German (20.4%, a difference of 0.050%), Immigrants from Spain (20.4%, a difference of 0.060%), Zimbabwean (20.4%, a difference of 0.080%), Mexican (20.5%, a difference of 0.13%), and Czech (20.4%, a difference of 0.17%).
| Demographics | Rating | Rank | Female Poverty Among 18-24 Year Olds |
| Nigerians | 23.4 /100 | #193 | Fair 20.4% |
| Mexican American Indians | 23.2 /100 | #194 | Fair 20.4% |
| Immigrants | Latvia | 23.0 /100 | #195 | Fair 20.4% |
| Czechs | 22.3 /100 | #196 | Fair 20.4% |
| Zimbabweans | 21.0 /100 | #197 | Fair 20.4% |
| Immigrants | Spain | 20.7 /100 | #198 | Fair 20.4% |
| Germans | 20.6 /100 | #199 | Fair 20.4% |
| Europeans | 19.9 /100 | #200 | Poor 20.4% |
| Mexicans | 18.3 /100 | #201 | Poor 20.5% |
| Immigrants | Turkey | 17.7 /100 | #202 | Poor 20.5% |
| Immigrants | Malaysia | 17.2 /100 | #203 | Poor 20.5% |
| Immigrants | Netherlands | 17.0 /100 | #204 | Poor 20.5% |
| English | 16.7 /100 | #205 | Poor 20.5% |
| Hispanics or Latinos | 16.6 /100 | #206 | Poor 20.5% |
| Spaniards | 16.3 /100 | #207 | Poor 20.5% |