Lumbee vs Argentinean Child Poverty Under the Age of 16
COMPARE
Lumbee
Argentinean
Child Poverty Under the Age of 16
Child Poverty Under the Age of 16 Comparison
Lumbee
Argentineans
31.0%
CHILD POVERTY UNDER THE AGE OF 16
0.0/ 100
METRIC RATING
345th/ 347
METRIC RANK
14.6%
CHILD POVERTY UNDER THE AGE OF 16
96.6/ 100
METRIC RATING
93rd/ 347
METRIC RANK
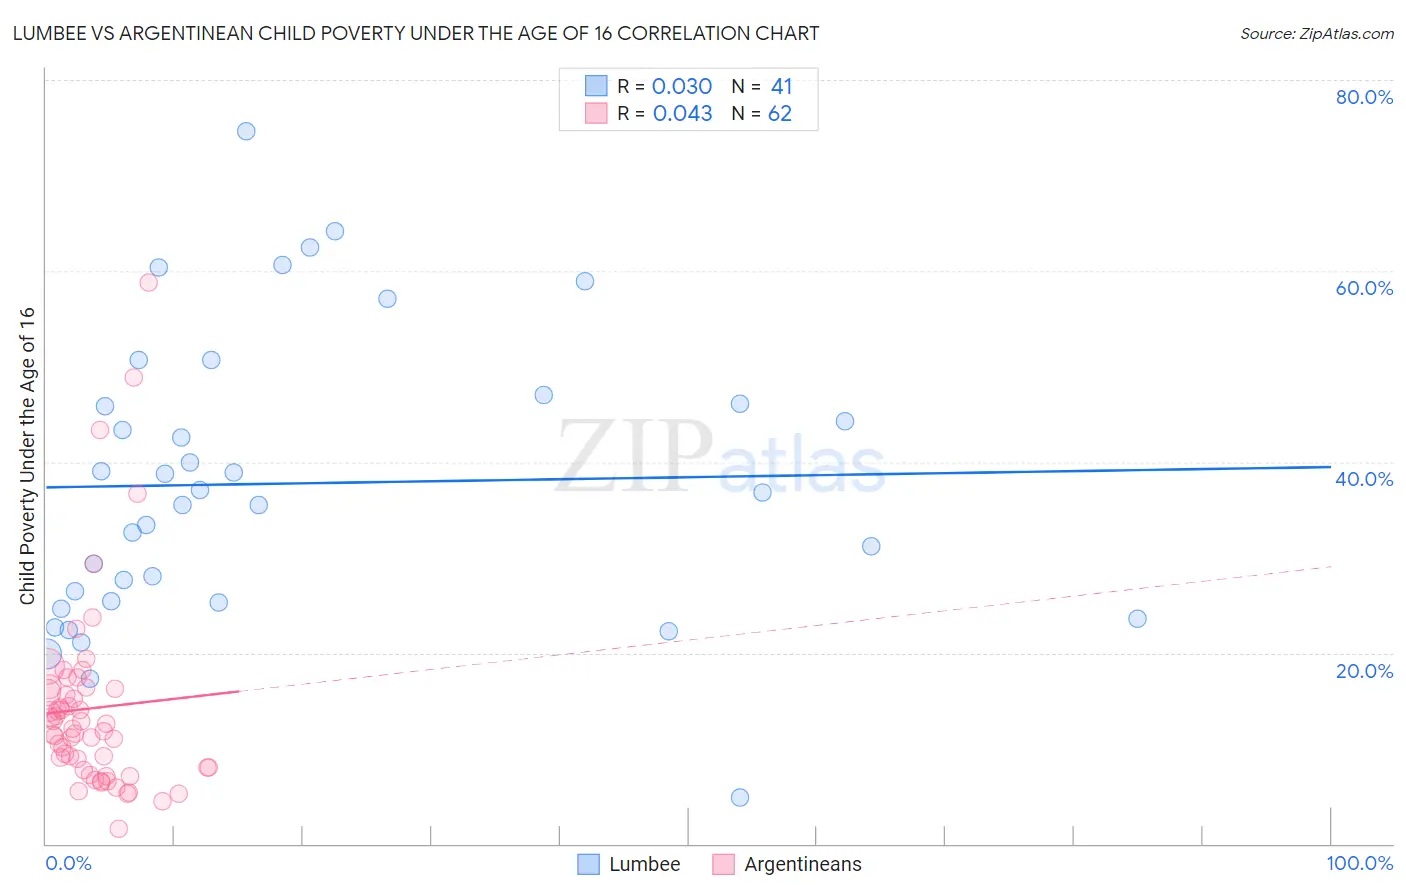
Lumbee vs Argentinean Child Poverty Under the Age of 16 Correlation Chart
The statistical analysis conducted on geographies consisting of 92,059,421 people shows no correlation between the proportion of Lumbee and poverty level among children under the age of 16 in the United States with a correlation coefficient (R) of 0.030 and weighted average of 31.0%. Similarly, the statistical analysis conducted on geographies consisting of 295,166,433 people shows no correlation between the proportion of Argentineans and poverty level among children under the age of 16 in the United States with a correlation coefficient (R) of 0.043 and weighted average of 14.6%, a difference of 112.5%.
Child Poverty Under the Age of 16 Correlation Summary
| Measurement | Lumbee | Argentinean |
| Minimum | 4.9% | 1.6% |
| Maximum | 74.7% | 58.8% |
| Range | 69.8% | 57.2% |
| Mean | 37.7% | 14.2% |
| Median | 36.8% | 11.9% |
| Interquartile 25% (IQ1) | 25.3% | 8.0% |
| Interquartile 75% (IQ3) | 46.6% | 16.3% |
| Interquartile Range (IQR) | 21.3% | 8.2% |
| Standard Deviation (Sample) | 15.1% | 10.3% |
| Standard Deviation (Population) | 15.0% | 10.2% |
Similar Demographics by Child Poverty Under the Age of 16
Demographics Similar to Lumbee by Child Poverty Under the Age of 16
In terms of child poverty under the age of 16, the demographic groups most similar to Lumbee are Tohono O'odham (31.7%, a difference of 2.3%), Navajo (30.2%, a difference of 2.5%), Puerto Rican (32.5%, a difference of 5.0%), Immigrants from Yemen (29.1%, a difference of 6.5%), and Pima (29.0%, a difference of 6.8%).
| Demographics | Rating | Rank | Child Poverty Under the Age of 16 |
| Immigrants | Dominican Republic | 0.0 /100 | #333 | Tragic 24.0% |
| Blacks/African Americans | 0.0 /100 | #334 | Tragic 24.4% |
| Houma | 0.0 /100 | #335 | Tragic 24.9% |
| Yup'ik | 0.0 /100 | #336 | Tragic 25.1% |
| Sioux | 0.0 /100 | #337 | Tragic 25.2% |
| Cheyenne | 0.0 /100 | #338 | Tragic 25.4% |
| Crow | 0.0 /100 | #339 | Tragic 26.0% |
| Hopi | 0.0 /100 | #340 | Tragic 27.1% |
| Yuman | 0.0 /100 | #341 | Tragic 28.9% |
| Pima | 0.0 /100 | #342 | Tragic 29.0% |
| Immigrants | Yemen | 0.0 /100 | #343 | Tragic 29.1% |
| Navajo | 0.0 /100 | #344 | Tragic 30.2% |
| Lumbee | 0.0 /100 | #345 | Tragic 31.0% |
| Tohono O'odham | 0.0 /100 | #346 | Tragic 31.7% |
| Puerto Ricans | 0.0 /100 | #347 | Tragic 32.5% |
Demographics Similar to Argentineans by Child Poverty Under the Age of 16
In terms of child poverty under the age of 16, the demographic groups most similar to Argentineans are Immigrants from Italy (14.6%, a difference of 0.090%), Immigrants from North America (14.6%, a difference of 0.12%), Immigrants from South Africa (14.6%, a difference of 0.28%), Austrian (14.5%, a difference of 0.31%), and German (14.5%, a difference of 0.37%).
| Demographics | Rating | Rank | Child Poverty Under the Age of 16 |
| Immigrants | Argentina | 97.1 /100 | #86 | Exceptional 14.5% |
| Taiwanese | 97.1 /100 | #87 | Exceptional 14.5% |
| Northern Europeans | 97.0 /100 | #88 | Exceptional 14.5% |
| Germans | 96.9 /100 | #89 | Exceptional 14.5% |
| Austrians | 96.9 /100 | #90 | Exceptional 14.5% |
| Immigrants | North America | 96.7 /100 | #91 | Exceptional 14.6% |
| Immigrants | Italy | 96.7 /100 | #92 | Exceptional 14.6% |
| Argentineans | 96.6 /100 | #93 | Exceptional 14.6% |
| Immigrants | South Africa | 96.3 /100 | #94 | Exceptional 14.6% |
| Immigrants | Croatia | 96.1 /100 | #95 | Exceptional 14.6% |
| Immigrants | France | 95.8 /100 | #96 | Exceptional 14.7% |
| Paraguayans | 95.7 /100 | #97 | Exceptional 14.7% |
| Immigrants | Belarus | 95.7 /100 | #98 | Exceptional 14.7% |
| British | 95.5 /100 | #99 | Exceptional 14.7% |
| Dutch | 95.1 /100 | #100 | Exceptional 14.8% |