Cheyenne vs Yakama 10th Grade
COMPARE
Cheyenne
Yakama
10th Grade
10th Grade Comparison
Cheyenne
Yakama
93.5%
10TH GRADE
26.8/ 100
METRIC RATING
195th/ 347
METRIC RANK
86.9%
10TH GRADE
0.0/ 100
METRIC RATING
343rd/ 347
METRIC RANK
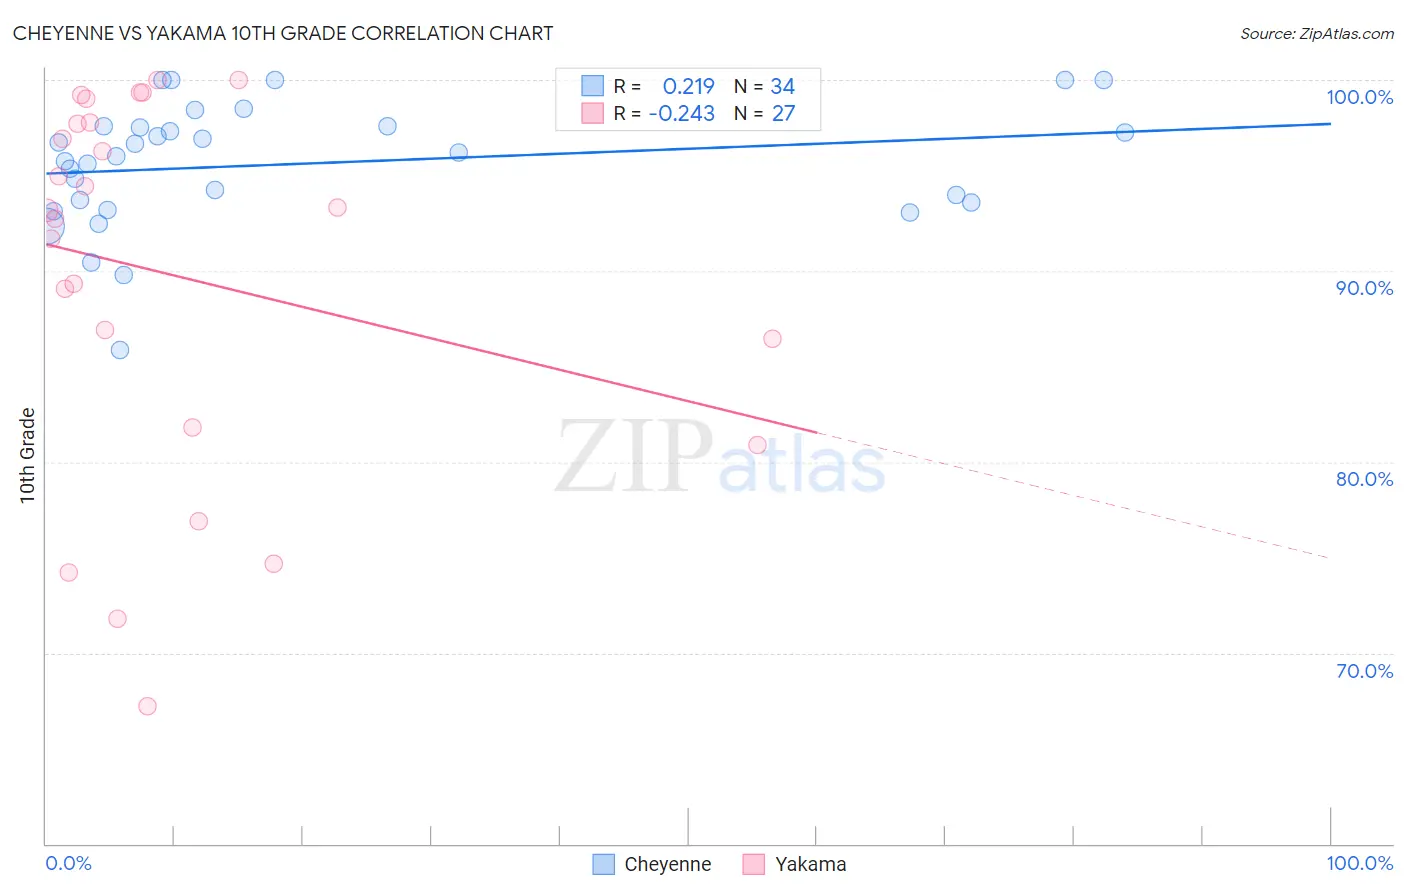
Cheyenne vs Yakama 10th Grade Correlation Chart
The statistical analysis conducted on geographies consisting of 80,719,411 people shows a weak positive correlation between the proportion of Cheyenne and percentage of population with at least 10th grade education in the United States with a correlation coefficient (R) of 0.219 and weighted average of 93.5%. Similarly, the statistical analysis conducted on geographies consisting of 19,923,144 people shows a weak negative correlation between the proportion of Yakama and percentage of population with at least 10th grade education in the United States with a correlation coefficient (R) of -0.243 and weighted average of 86.9%, a difference of 7.6%.
10th Grade Correlation Summary
| Measurement | Cheyenne | Yakama |
| Minimum | 85.8% | 67.2% |
| Maximum | 100.0% | 100.0% |
| Range | 14.2% | 32.8% |
| Mean | 95.6% | 89.8% |
| Median | 96.1% | 93.2% |
| Interquartile 25% (IQ1) | 93.6% | 81.8% |
| Interquartile 75% (IQ3) | 97.6% | 97.8% |
| Interquartile Range (IQR) | 4.0% | 16.0% |
| Standard Deviation (Sample) | 3.2% | 9.8% |
| Standard Deviation (Population) | 3.2% | 9.6% |
Similar Demographics by 10th Grade
Demographics Similar to Cheyenne by 10th Grade
In terms of 10th grade, the demographic groups most similar to Cheyenne are Immigrants from Morocco (93.5%, a difference of 0.0%), Immigrants from Malaysia (93.5%, a difference of 0.010%), Panamanian (93.5%, a difference of 0.010%), Moroccan (93.5%, a difference of 0.020%), and Pueblo (93.5%, a difference of 0.030%).
| Demographics | Rating | Rank | 10th Grade |
| Marshallese | 33.2 /100 | #188 | Fair 93.6% |
| Immigrants | Pakistan | 32.5 /100 | #189 | Fair 93.6% |
| Laotians | 32.1 /100 | #190 | Fair 93.6% |
| Yup'ik | 31.1 /100 | #191 | Fair 93.6% |
| Immigrants | Malaysia | 28.0 /100 | #192 | Fair 93.5% |
| Panamanians | 28.0 /100 | #193 | Fair 93.5% |
| Immigrants | Morocco | 26.9 /100 | #194 | Fair 93.5% |
| Cheyenne | 26.8 /100 | #195 | Fair 93.5% |
| Moroccans | 25.3 /100 | #196 | Fair 93.5% |
| Pueblo | 23.9 /100 | #197 | Fair 93.5% |
| Immigrants | Micronesia | 23.2 /100 | #198 | Fair 93.5% |
| Asians | 23.0 /100 | #199 | Fair 93.5% |
| Hopi | 22.2 /100 | #200 | Fair 93.5% |
| Hawaiians | 21.8 /100 | #201 | Fair 93.5% |
| Immigrants | Uganda | 20.9 /100 | #202 | Fair 93.5% |
Demographics Similar to Yakama by 10th Grade
In terms of 10th grade, the demographic groups most similar to Yakama are Immigrants from El Salvador (86.8%, a difference of 0.14%), Immigrants from Central America (86.6%, a difference of 0.32%), Immigrants from Guatemala (87.4%, a difference of 0.58%), Salvadoran (87.5%, a difference of 0.74%), and Spanish American Indian (86.2%, a difference of 0.77%).
| Demographics | Rating | Rank | 10th Grade |
| Hondurans | 0.0 /100 | #333 | Tragic 89.0% |
| Hispanics or Latinos | 0.0 /100 | #334 | Tragic 88.9% |
| Immigrants | Dominican Republic | 0.0 /100 | #335 | Tragic 88.7% |
| Immigrants | Honduras | 0.0 /100 | #336 | Tragic 88.5% |
| Central Americans | 0.0 /100 | #337 | Tragic 88.4% |
| Immigrants | Latin America | 0.0 /100 | #338 | Tragic 88.3% |
| Guatemalans | 0.0 /100 | #339 | Tragic 87.9% |
| Mexicans | 0.0 /100 | #340 | Tragic 87.8% |
| Salvadorans | 0.0 /100 | #341 | Tragic 87.5% |
| Immigrants | Guatemala | 0.0 /100 | #342 | Tragic 87.4% |
| Yakama | 0.0 /100 | #343 | Tragic 86.9% |
| Immigrants | El Salvador | 0.0 /100 | #344 | Tragic 86.8% |
| Immigrants | Central America | 0.0 /100 | #345 | Tragic 86.6% |
| Spanish American Indians | 0.0 /100 | #346 | Tragic 86.2% |
| Immigrants | Mexico | 0.0 /100 | #347 | Tragic 86.2% |