Cheyenne vs Sioux Receiving Food Stamps
COMPARE
Cheyenne
Sioux
Receiving Food Stamps
Receiving Food Stamps Comparison
Cheyenne
Sioux
14.3%
RECEIVING FOOD STAMPS
0.2/ 100
METRIC RATING
266th/ 347
METRIC RANK
16.8%
RECEIVING FOOD STAMPS
0.0/ 100
METRIC RATING
312th/ 347
METRIC RANK
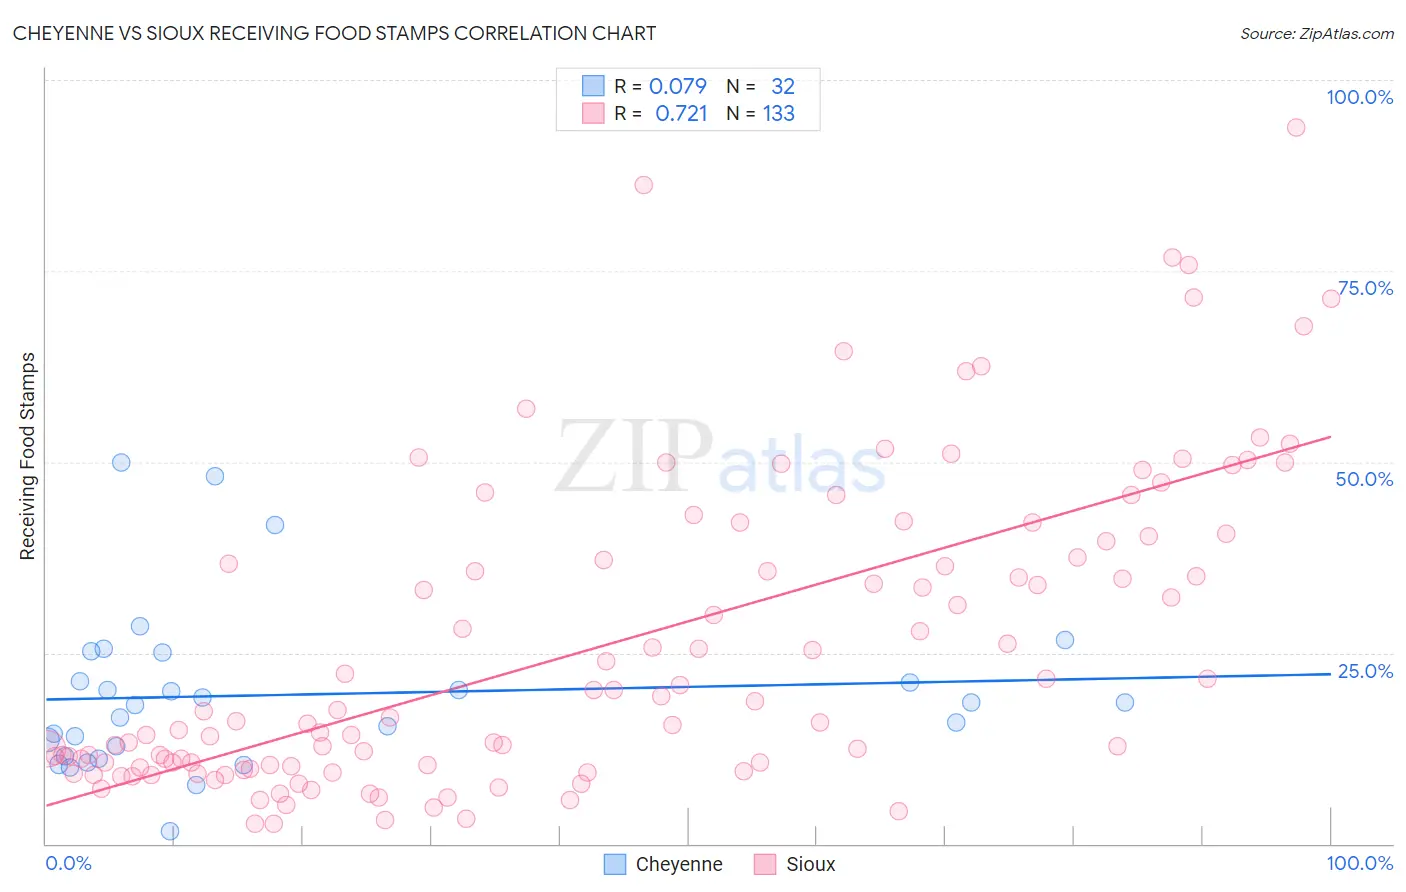
Cheyenne vs Sioux Receiving Food Stamps Correlation Chart
The statistical analysis conducted on geographies consisting of 80,695,470 people shows a slight positive correlation between the proportion of Cheyenne and percentage of population receiving government assistance and/or food stamps in the United States with a correlation coefficient (R) of 0.079 and weighted average of 14.3%. Similarly, the statistical analysis conducted on geographies consisting of 234,002,578 people shows a strong positive correlation between the proportion of Sioux and percentage of population receiving government assistance and/or food stamps in the United States with a correlation coefficient (R) of 0.721 and weighted average of 16.8%, a difference of 17.7%.
Receiving Food Stamps Correlation Summary
| Measurement | Cheyenne | Sioux |
| Minimum | 1.6% | 2.6% |
| Maximum | 50.0% | 93.8% |
| Range | 48.4% | 91.2% |
| Mean | 19.5% | 26.1% |
| Median | 18.3% | 17.3% |
| Interquartile 25% (IQ1) | 12.1% | 10.3% |
| Interquartile 75% (IQ3) | 23.2% | 39.9% |
| Interquartile Range (IQR) | 11.0% | 29.7% |
| Standard Deviation (Sample) | 10.8% | 20.2% |
| Standard Deviation (Population) | 10.6% | 20.2% |
Similar Demographics by Receiving Food Stamps
Demographics Similar to Cheyenne by Receiving Food Stamps
In terms of receiving food stamps, the demographic groups most similar to Cheyenne are Blackfeet (14.3%, a difference of 0.080%), Immigrants from Uzbekistan (14.3%, a difference of 0.14%), Dutch West Indian (14.3%, a difference of 0.22%), Paiute (14.3%, a difference of 0.23%), and Immigrants from Portugal (14.3%, a difference of 0.23%).
| Demographics | Rating | Rank | Receiving Food Stamps |
| Creek | 0.3 /100 | #259 | Tragic 14.1% |
| Central Americans | 0.3 /100 | #260 | Tragic 14.1% |
| Immigrants | Congo | 0.3 /100 | #261 | Tragic 14.1% |
| Paiute | 0.2 /100 | #262 | Tragic 14.3% |
| Immigrants | Portugal | 0.2 /100 | #263 | Tragic 14.3% |
| Immigrants | Uzbekistan | 0.2 /100 | #264 | Tragic 14.3% |
| Blackfeet | 0.2 /100 | #265 | Tragic 14.3% |
| Cheyenne | 0.2 /100 | #266 | Tragic 14.3% |
| Dutch West Indians | 0.2 /100 | #267 | Tragic 14.3% |
| Guatemalans | 0.1 /100 | #268 | Tragic 14.4% |
| Nepalese | 0.1 /100 | #269 | Tragic 14.6% |
| Mexicans | 0.1 /100 | #270 | Tragic 14.6% |
| Immigrants | Guatemala | 0.1 /100 | #271 | Tragic 14.6% |
| Chippewa | 0.1 /100 | #272 | Tragic 14.7% |
| Alaskan Athabascans | 0.1 /100 | #273 | Tragic 14.7% |
Demographics Similar to Sioux by Receiving Food Stamps
In terms of receiving food stamps, the demographic groups most similar to Sioux are Immigrants from Jamaica (16.9%, a difference of 0.28%), Immigrants from Guyana (16.9%, a difference of 0.45%), Guyanese (16.7%, a difference of 0.70%), Bahamian (17.0%, a difference of 1.0%), and Immigrants from Barbados (16.6%, a difference of 1.2%).
| Demographics | Rating | Rank | Receiving Food Stamps |
| Immigrants | Azores | 0.0 /100 | #305 | Tragic 16.4% |
| Jamaicans | 0.0 /100 | #306 | Tragic 16.4% |
| Houma | 0.0 /100 | #307 | Tragic 16.5% |
| Barbadians | 0.0 /100 | #308 | Tragic 16.5% |
| U.S. Virgin Islanders | 0.0 /100 | #309 | Tragic 16.5% |
| Immigrants | Barbados | 0.0 /100 | #310 | Tragic 16.6% |
| Guyanese | 0.0 /100 | #311 | Tragic 16.7% |
| Sioux | 0.0 /100 | #312 | Tragic 16.8% |
| Immigrants | Jamaica | 0.0 /100 | #313 | Tragic 16.9% |
| Immigrants | Guyana | 0.0 /100 | #314 | Tragic 16.9% |
| Bahamians | 0.0 /100 | #315 | Tragic 17.0% |
| Central American Indians | 0.0 /100 | #316 | Tragic 17.1% |
| Blacks/African Americans | 0.0 /100 | #317 | Tragic 17.2% |
| Menominee | 0.0 /100 | #318 | Tragic 17.2% |
| Immigrants | St. Vincent and the Grenadines | 0.0 /100 | #319 | Tragic 17.2% |