Cheyenne vs Immigrants from Australia Receiving Food Stamps
COMPARE
Cheyenne
Immigrants from Australia
Receiving Food Stamps
Receiving Food Stamps Comparison
Cheyenne
Immigrants from Australia
14.3%
RECEIVING FOOD STAMPS
0.2/ 100
METRIC RATING
266th/ 347
METRIC RANK
9.2%
RECEIVING FOOD STAMPS
99.8/ 100
METRIC RATING
22nd/ 347
METRIC RANK
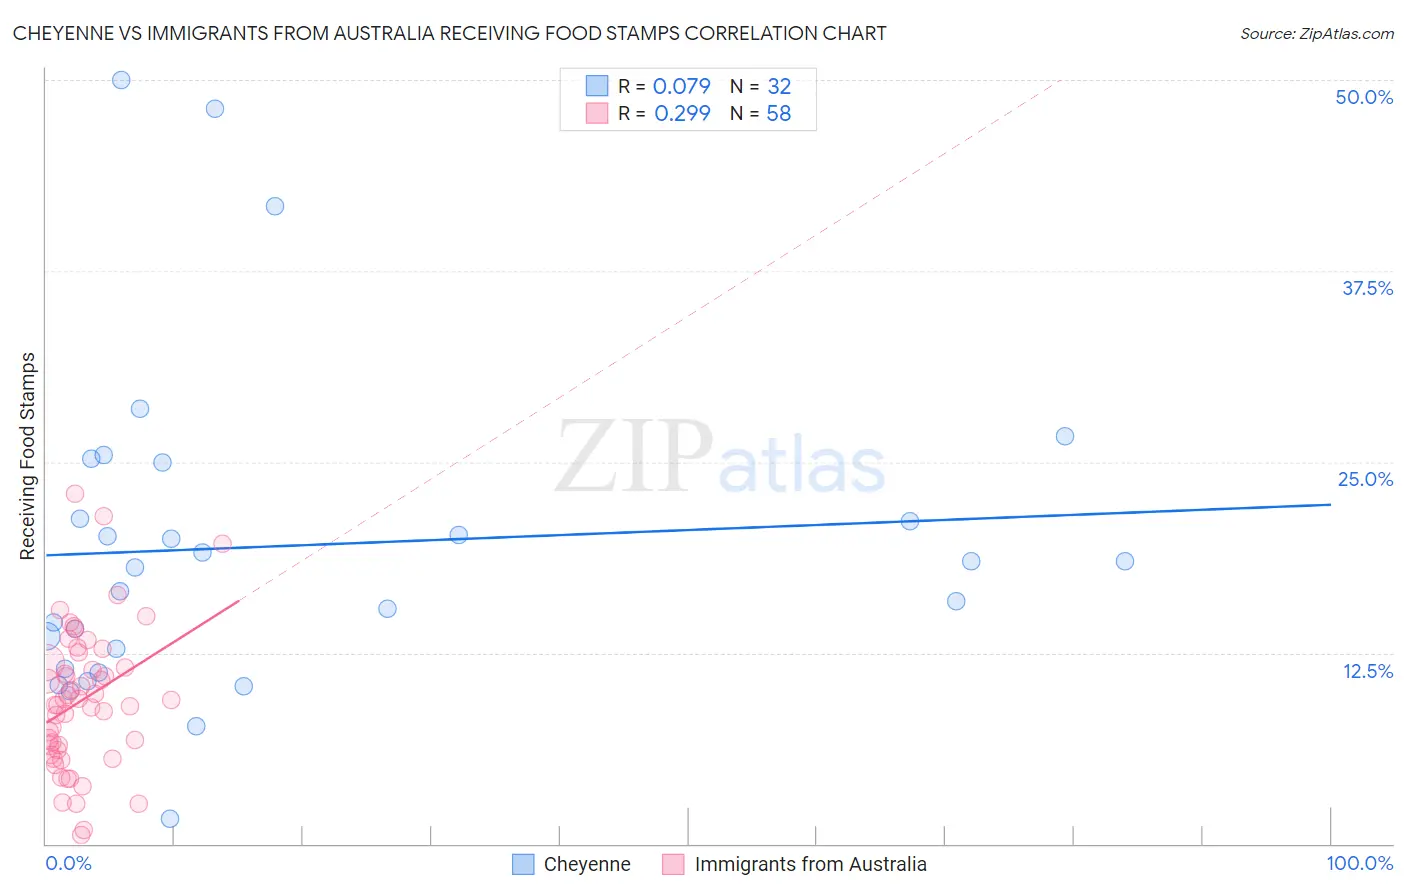
Cheyenne vs Immigrants from Australia Receiving Food Stamps Correlation Chart
The statistical analysis conducted on geographies consisting of 80,695,470 people shows a slight positive correlation between the proportion of Cheyenne and percentage of population receiving government assistance and/or food stamps in the United States with a correlation coefficient (R) of 0.079 and weighted average of 14.3%. Similarly, the statistical analysis conducted on geographies consisting of 226,603,605 people shows a weak positive correlation between the proportion of Immigrants from Australia and percentage of population receiving government assistance and/or food stamps in the United States with a correlation coefficient (R) of 0.299 and weighted average of 9.2%, a difference of 56.1%.
Receiving Food Stamps Correlation Summary
| Measurement | Cheyenne | Immigrants from Australia |
| Minimum | 1.6% | 0.57% |
| Maximum | 50.0% | 22.9% |
| Range | 48.4% | 22.3% |
| Mean | 19.5% | 9.4% |
| Median | 18.3% | 9.3% |
| Interquartile 25% (IQ1) | 12.1% | 6.1% |
| Interquartile 75% (IQ3) | 23.2% | 11.8% |
| Interquartile Range (IQR) | 11.0% | 5.7% |
| Standard Deviation (Sample) | 10.8% | 4.7% |
| Standard Deviation (Population) | 10.6% | 4.6% |
Similar Demographics by Receiving Food Stamps
Demographics Similar to Cheyenne by Receiving Food Stamps
In terms of receiving food stamps, the demographic groups most similar to Cheyenne are Blackfeet (14.3%, a difference of 0.080%), Immigrants from Uzbekistan (14.3%, a difference of 0.14%), Dutch West Indian (14.3%, a difference of 0.22%), Paiute (14.3%, a difference of 0.23%), and Immigrants from Portugal (14.3%, a difference of 0.23%).
| Demographics | Rating | Rank | Receiving Food Stamps |
| Creek | 0.3 /100 | #259 | Tragic 14.1% |
| Central Americans | 0.3 /100 | #260 | Tragic 14.1% |
| Immigrants | Congo | 0.3 /100 | #261 | Tragic 14.1% |
| Paiute | 0.2 /100 | #262 | Tragic 14.3% |
| Immigrants | Portugal | 0.2 /100 | #263 | Tragic 14.3% |
| Immigrants | Uzbekistan | 0.2 /100 | #264 | Tragic 14.3% |
| Blackfeet | 0.2 /100 | #265 | Tragic 14.3% |
| Cheyenne | 0.2 /100 | #266 | Tragic 14.3% |
| Dutch West Indians | 0.2 /100 | #267 | Tragic 14.3% |
| Guatemalans | 0.1 /100 | #268 | Tragic 14.4% |
| Nepalese | 0.1 /100 | #269 | Tragic 14.6% |
| Mexicans | 0.1 /100 | #270 | Tragic 14.6% |
| Immigrants | Guatemala | 0.1 /100 | #271 | Tragic 14.6% |
| Chippewa | 0.1 /100 | #272 | Tragic 14.7% |
| Alaskan Athabascans | 0.1 /100 | #273 | Tragic 14.7% |
Demographics Similar to Immigrants from Australia by Receiving Food Stamps
In terms of receiving food stamps, the demographic groups most similar to Immigrants from Australia are Eastern European (9.2%, a difference of 0.11%), Immigrants from Northern Europe (9.2%, a difference of 0.13%), Immigrants from Ireland (9.2%, a difference of 0.24%), Luxembourger (9.1%, a difference of 0.25%), and Latvian (9.1%, a difference of 0.40%).
| Demographics | Rating | Rank | Receiving Food Stamps |
| Norwegians | 99.9 /100 | #15 | Exceptional 9.0% |
| Immigrants | Japan | 99.9 /100 | #16 | Exceptional 9.0% |
| Immigrants | Scotland | 99.9 /100 | #17 | Exceptional 9.0% |
| Danes | 99.9 /100 | #18 | Exceptional 9.0% |
| Immigrants | Hong Kong | 99.8 /100 | #19 | Exceptional 9.1% |
| Latvians | 99.8 /100 | #20 | Exceptional 9.1% |
| Luxembourgers | 99.8 /100 | #21 | Exceptional 9.1% |
| Immigrants | Australia | 99.8 /100 | #22 | Exceptional 9.2% |
| Eastern Europeans | 99.8 /100 | #23 | Exceptional 9.2% |
| Immigrants | Northern Europe | 99.8 /100 | #24 | Exceptional 9.2% |
| Immigrants | Ireland | 99.8 /100 | #25 | Exceptional 9.2% |
| Swedes | 99.8 /100 | #26 | Exceptional 9.2% |
| Bhutanese | 99.8 /100 | #27 | Exceptional 9.2% |
| Czechs | 99.8 /100 | #28 | Exceptional 9.2% |
| Immigrants | Lithuania | 99.8 /100 | #29 | Exceptional 9.2% |