Cheyenne vs Liberian Single Mother Poverty
COMPARE
Cheyenne
Liberian
Single Mother Poverty
Single Mother Poverty Comparison
Cheyenne
Liberians
38.5%
SINGLE MOTHER POVERTY
0.0/ 100
METRIC RATING
336th/ 347
METRIC RANK
29.9%
SINGLE MOTHER POVERTY
11.7/ 100
METRIC RATING
214th/ 347
METRIC RANK
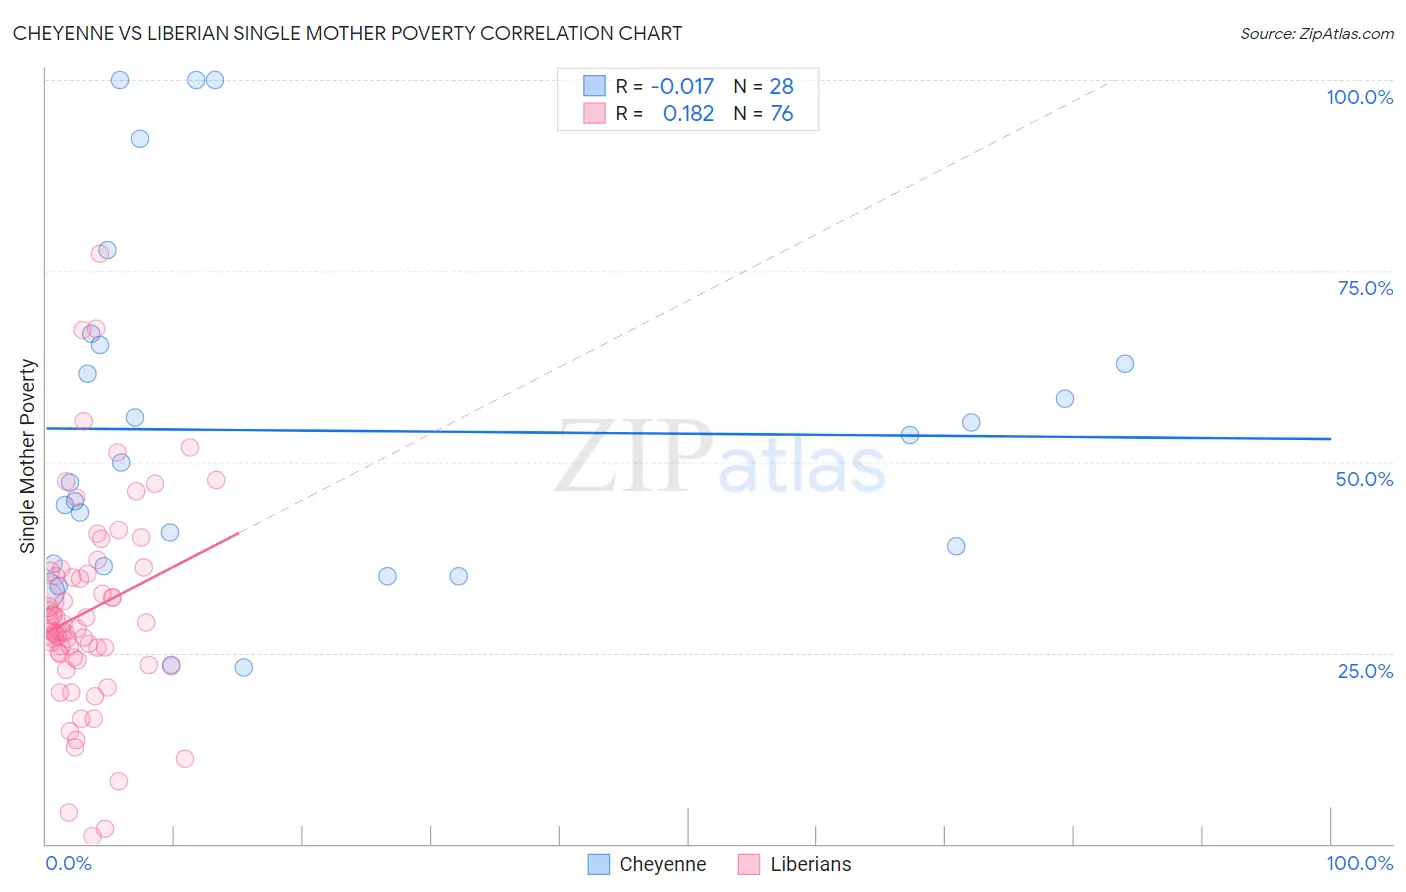
Cheyenne vs Liberian Single Mother Poverty Correlation Chart
The statistical analysis conducted on geographies consisting of 80,348,704 people shows no correlation between the proportion of Cheyenne and poverty level among single mothers in the United States with a correlation coefficient (R) of -0.017 and weighted average of 38.5%. Similarly, the statistical analysis conducted on geographies consisting of 117,524,642 people shows a poor positive correlation between the proportion of Liberians and poverty level among single mothers in the United States with a correlation coefficient (R) of 0.182 and weighted average of 29.9%, a difference of 28.9%.
Single Mother Poverty Correlation Summary
| Measurement | Cheyenne | Liberian |
| Minimum | 23.1% | 1.1% |
| Maximum | 100.0% | 77.3% |
| Range | 76.9% | 76.3% |
| Mean | 54.1% | 30.4% |
| Median | 48.6% | 28.0% |
| Interquartile 25% (IQ1) | 36.5% | 24.7% |
| Interquartile 75% (IQ3) | 64.1% | 35.5% |
| Interquartile Range (IQR) | 27.6% | 10.8% |
| Standard Deviation (Sample) | 22.5% | 13.6% |
| Standard Deviation (Population) | 22.1% | 13.5% |
Similar Demographics by Single Mother Poverty
Demographics Similar to Cheyenne by Single Mother Poverty
In terms of single mother poverty, the demographic groups most similar to Cheyenne are Immigrants from Yemen (38.5%, a difference of 0.040%), Pima (38.6%, a difference of 0.25%), Crow (38.6%, a difference of 0.34%), Sioux (38.8%, a difference of 0.74%), and Yuman (37.8%, a difference of 1.9%).
| Demographics | Rating | Rank | Single Mother Poverty |
| Apache | 0.0 /100 | #329 | Tragic 36.6% |
| Natives/Alaskans | 0.0 /100 | #330 | Tragic 36.6% |
| Creek | 0.0 /100 | #331 | Tragic 36.7% |
| Dutch West Indians | 0.0 /100 | #332 | Tragic 36.8% |
| Menominee | 0.0 /100 | #333 | Tragic 37.1% |
| Pueblo | 0.0 /100 | #334 | Tragic 37.2% |
| Yuman | 0.0 /100 | #335 | Tragic 37.8% |
| Cheyenne | 0.0 /100 | #336 | Tragic 38.5% |
| Immigrants | Yemen | 0.0 /100 | #337 | Tragic 38.5% |
| Pima | 0.0 /100 | #338 | Tragic 38.6% |
| Crow | 0.0 /100 | #339 | Tragic 38.6% |
| Sioux | 0.0 /100 | #340 | Tragic 38.8% |
| Colville | 0.0 /100 | #341 | Tragic 39.3% |
| Navajo | 0.0 /100 | #342 | Tragic 40.2% |
| Cajuns | 0.0 /100 | #343 | Tragic 40.3% |
Demographics Similar to Liberians by Single Mother Poverty
In terms of single mother poverty, the demographic groups most similar to Liberians are Jamaican (29.9%, a difference of 0.0%), Immigrants from Western Africa (29.9%, a difference of 0.020%), Immigrants from Thailand (29.9%, a difference of 0.030%), Immigrants from Ghana (29.9%, a difference of 0.050%), and Nicaraguan (29.8%, a difference of 0.080%).
| Demographics | Rating | Rank | Single Mother Poverty |
| Immigrants | Panama | 15.5 /100 | #207 | Poor 29.8% |
| Immigrants | Guyana | 14.7 /100 | #208 | Poor 29.8% |
| Irish | 13.9 /100 | #209 | Poor 29.8% |
| Haitians | 13.3 /100 | #210 | Poor 29.8% |
| Guyanese | 12.8 /100 | #211 | Poor 29.8% |
| Nicaraguans | 12.4 /100 | #212 | Poor 29.8% |
| Immigrants | Thailand | 12.0 /100 | #213 | Poor 29.9% |
| Liberians | 11.7 /100 | #214 | Poor 29.9% |
| Jamaicans | 11.7 /100 | #215 | Poor 29.9% |
| Immigrants | Western Africa | 11.5 /100 | #216 | Poor 29.9% |
| Immigrants | Ghana | 11.3 /100 | #217 | Poor 29.9% |
| Hungarians | 10.3 /100 | #218 | Poor 29.9% |
| Finns | 9.3 /100 | #219 | Tragic 30.0% |
| Germans | 8.8 /100 | #220 | Tragic 30.0% |
| Immigrants | Eritrea | 7.7 /100 | #221 | Tragic 30.0% |