Cheyenne vs Panamanian Single Mother Poverty
COMPARE
Cheyenne
Panamanian
Single Mother Poverty
Single Mother Poverty Comparison
Cheyenne
Panamanians
38.5%
SINGLE MOTHER POVERTY
0.0/ 100
METRIC RATING
336th/ 347
METRIC RANK
29.6%
SINGLE MOTHER POVERTY
20.0/ 100
METRIC RATING
200th/ 347
METRIC RANK
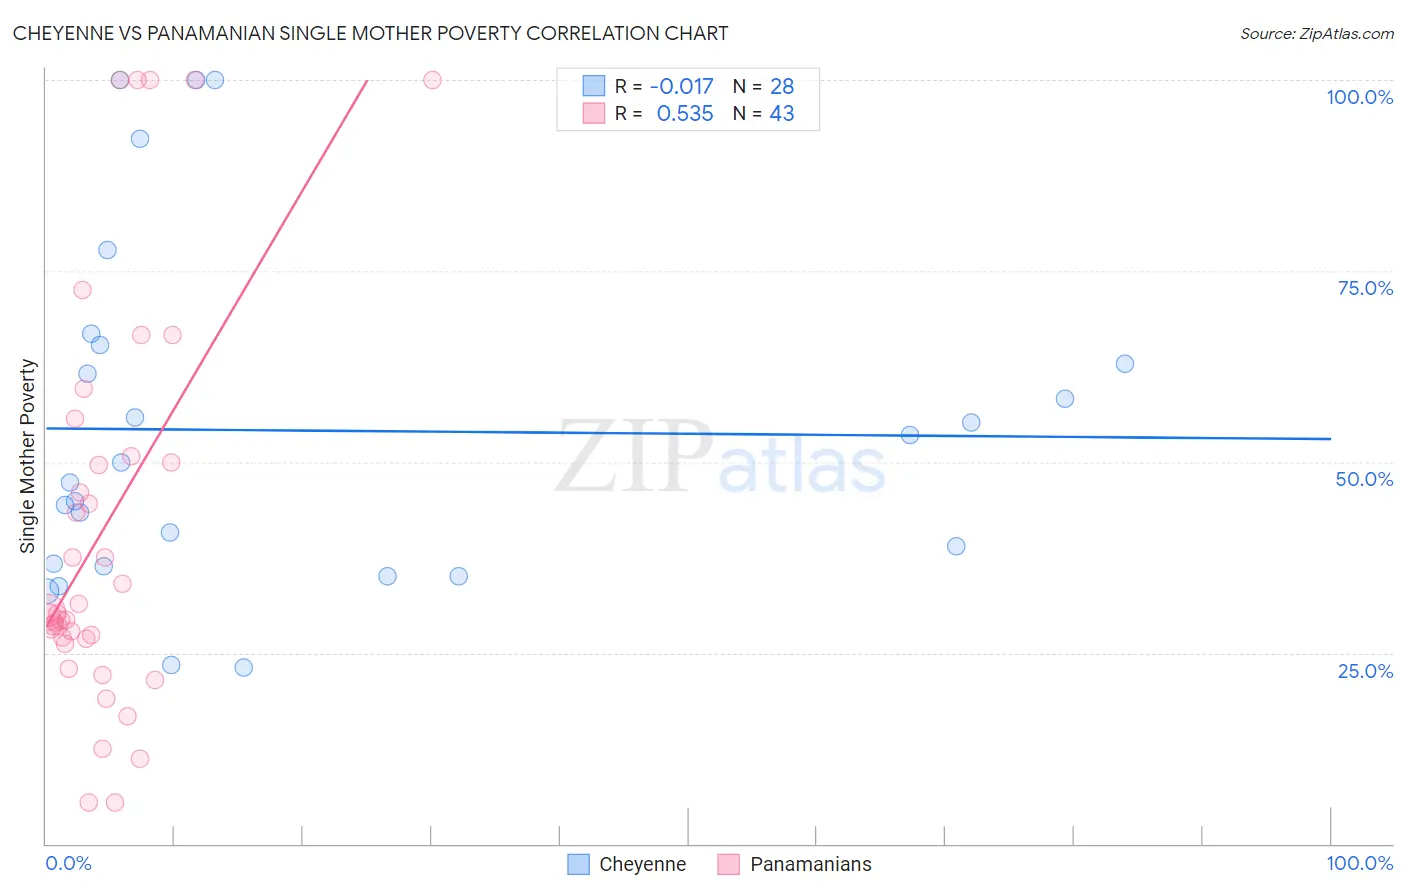
Cheyenne vs Panamanian Single Mother Poverty Correlation Chart
The statistical analysis conducted on geographies consisting of 80,348,704 people shows no correlation between the proportion of Cheyenne and poverty level among single mothers in the United States with a correlation coefficient (R) of -0.017 and weighted average of 38.5%. Similarly, the statistical analysis conducted on geographies consisting of 277,785,222 people shows a substantial positive correlation between the proportion of Panamanians and poverty level among single mothers in the United States with a correlation coefficient (R) of 0.535 and weighted average of 29.6%, a difference of 29.8%.
Single Mother Poverty Correlation Summary
| Measurement | Cheyenne | Panamanian |
| Minimum | 23.1% | 5.3% |
| Maximum | 100.0% | 100.0% |
| Range | 76.9% | 94.7% |
| Mean | 54.1% | 41.4% |
| Median | 48.6% | 30.1% |
| Interquartile 25% (IQ1) | 36.5% | 26.9% |
| Interquartile 75% (IQ3) | 64.1% | 50.7% |
| Interquartile Range (IQR) | 27.6% | 23.8% |
| Standard Deviation (Sample) | 22.5% | 26.4% |
| Standard Deviation (Population) | 22.1% | 26.1% |
Similar Demographics by Single Mother Poverty
Demographics Similar to Cheyenne by Single Mother Poverty
In terms of single mother poverty, the demographic groups most similar to Cheyenne are Immigrants from Yemen (38.5%, a difference of 0.040%), Pima (38.6%, a difference of 0.25%), Crow (38.6%, a difference of 0.34%), Sioux (38.8%, a difference of 0.74%), and Yuman (37.8%, a difference of 1.9%).
| Demographics | Rating | Rank | Single Mother Poverty |
| Apache | 0.0 /100 | #329 | Tragic 36.6% |
| Natives/Alaskans | 0.0 /100 | #330 | Tragic 36.6% |
| Creek | 0.0 /100 | #331 | Tragic 36.7% |
| Dutch West Indians | 0.0 /100 | #332 | Tragic 36.8% |
| Menominee | 0.0 /100 | #333 | Tragic 37.1% |
| Pueblo | 0.0 /100 | #334 | Tragic 37.2% |
| Yuman | 0.0 /100 | #335 | Tragic 37.8% |
| Cheyenne | 0.0 /100 | #336 | Tragic 38.5% |
| Immigrants | Yemen | 0.0 /100 | #337 | Tragic 38.5% |
| Pima | 0.0 /100 | #338 | Tragic 38.6% |
| Crow | 0.0 /100 | #339 | Tragic 38.6% |
| Sioux | 0.0 /100 | #340 | Tragic 38.8% |
| Colville | 0.0 /100 | #341 | Tragic 39.3% |
| Navajo | 0.0 /100 | #342 | Tragic 40.2% |
| Cajuns | 0.0 /100 | #343 | Tragic 40.3% |
Demographics Similar to Panamanians by Single Mother Poverty
In terms of single mother poverty, the demographic groups most similar to Panamanians are Cuban (29.6%, a difference of 0.050%), Belgian (29.7%, a difference of 0.10%), Trinidadian and Tobagonian (29.6%, a difference of 0.12%), Immigrants from Jamaica (29.6%, a difference of 0.14%), and Malaysian (29.7%, a difference of 0.20%).
| Demographics | Rating | Rank | Single Mother Poverty |
| Basques | 28.3 /100 | #193 | Fair 29.5% |
| Icelanders | 26.1 /100 | #194 | Fair 29.5% |
| Slavs | 24.5 /100 | #195 | Fair 29.6% |
| Spanish American Indians | 23.4 /100 | #196 | Fair 29.6% |
| Immigrants | Jamaica | 22.0 /100 | #197 | Fair 29.6% |
| Trinidadians and Tobagonians | 21.7 /100 | #198 | Fair 29.6% |
| Cubans | 20.8 /100 | #199 | Fair 29.6% |
| Panamanians | 20.0 /100 | #200 | Fair 29.6% |
| Belgians | 18.8 /100 | #201 | Poor 29.7% |
| Malaysians | 17.4 /100 | #202 | Poor 29.7% |
| Swiss | 17.2 /100 | #203 | Poor 29.7% |
| Immigrants | Immigrants | 16.6 /100 | #204 | Poor 29.7% |
| Czechoslovakians | 16.1 /100 | #205 | Poor 29.7% |
| Immigrants | Haiti | 15.8 /100 | #206 | Poor 29.7% |
| Immigrants | Panama | 15.5 /100 | #207 | Poor 29.8% |