Cherokee vs West Indian Family Poverty
COMPARE
Cherokee
West Indian
Family Poverty
Family Poverty Comparison
Cherokee
West Indians
10.6%
FAMILY POVERTY
0.5/ 100
METRIC RATING
246th/ 347
METRIC RANK
11.5%
FAMILY POVERTY
0.0/ 100
METRIC RATING
290th/ 347
METRIC RANK
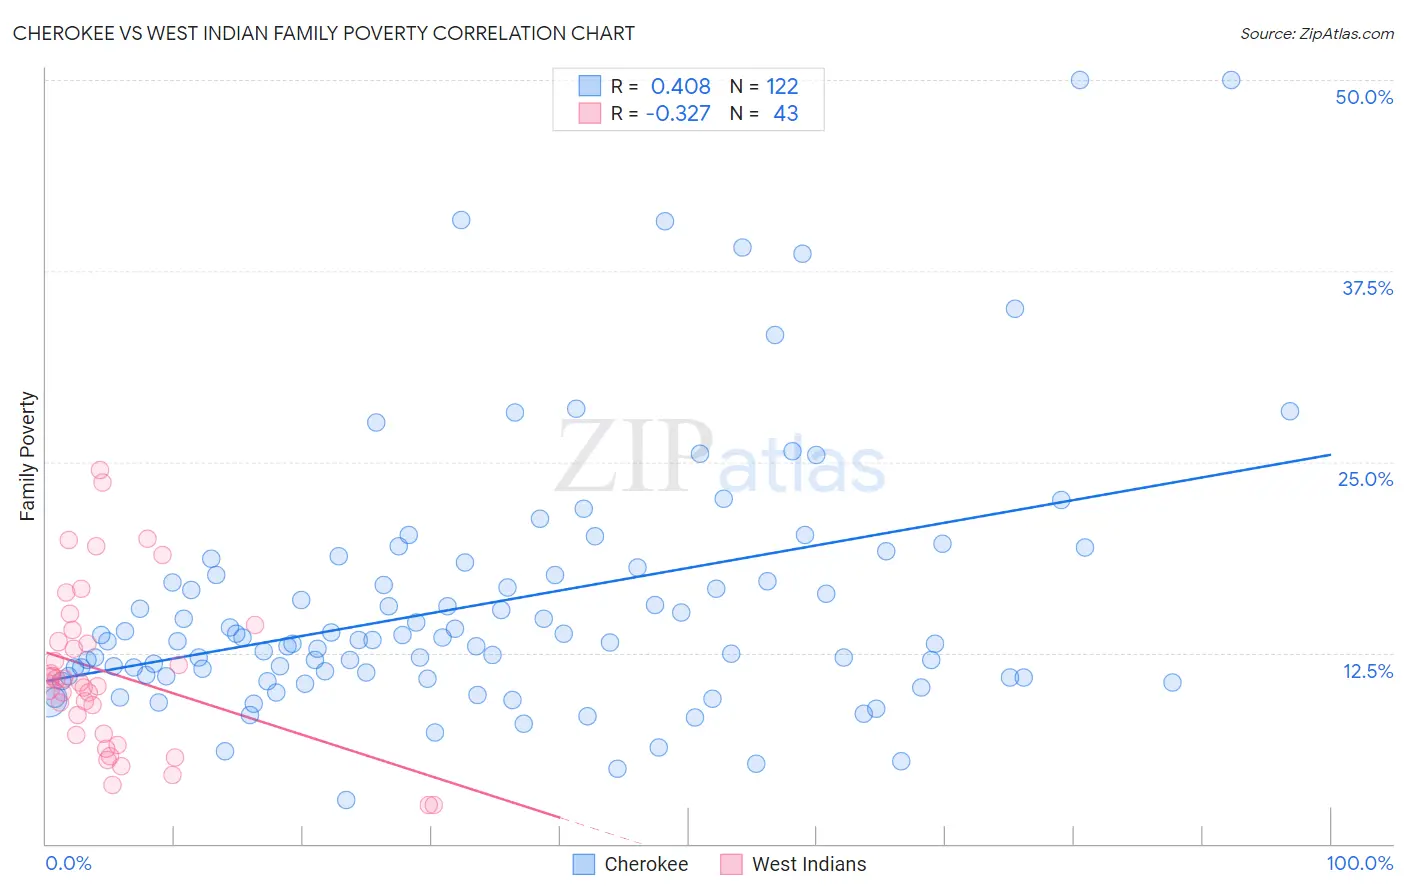
Cherokee vs West Indian Family Poverty Correlation Chart
The statistical analysis conducted on geographies consisting of 492,113,161 people shows a moderate positive correlation between the proportion of Cherokee and poverty level among families in the United States with a correlation coefficient (R) of 0.408 and weighted average of 10.6%. Similarly, the statistical analysis conducted on geographies consisting of 253,611,735 people shows a mild negative correlation between the proportion of West Indians and poverty level among families in the United States with a correlation coefficient (R) of -0.327 and weighted average of 11.5%, a difference of 8.8%.
Family Poverty Correlation Summary
| Measurement | Cherokee | West Indian |
| Minimum | 2.9% | 2.5% |
| Maximum | 50.0% | 24.5% |
| Range | 47.1% | 22.0% |
| Mean | 15.7% | 11.2% |
| Median | 13.3% | 10.5% |
| Interquartile 25% (IQ1) | 10.9% | 7.1% |
| Interquartile 75% (IQ3) | 17.6% | 14.0% |
| Interquartile Range (IQR) | 6.7% | 6.9% |
| Standard Deviation (Sample) | 8.5% | 5.3% |
| Standard Deviation (Population) | 8.4% | 5.3% |
Similar Demographics by Family Poverty
Demographics Similar to Cherokee by Family Poverty
In terms of family poverty, the demographic groups most similar to Cherokee are Liberian (10.6%, a difference of 0.090%), Nicaraguan (10.6%, a difference of 0.29%), Cuban (10.6%, a difference of 0.34%), Immigrants from Burma/Myanmar (10.5%, a difference of 0.64%), and Salvadoran (10.7%, a difference of 0.87%).
| Demographics | Rating | Rank | Family Poverty |
| Potawatomi | 1.5 /100 | #239 | Tragic 10.2% |
| Immigrants | Azores | 1.4 /100 | #240 | Tragic 10.3% |
| Ghanaians | 1.3 /100 | #241 | Tragic 10.3% |
| Alaska Natives | 1.0 /100 | #242 | Tragic 10.4% |
| Nepalese | 0.8 /100 | #243 | Tragic 10.4% |
| Cree | 0.7 /100 | #244 | Tragic 10.5% |
| Immigrants | Burma/Myanmar | 0.6 /100 | #245 | Tragic 10.5% |
| Cherokee | 0.5 /100 | #246 | Tragic 10.6% |
| Liberians | 0.4 /100 | #247 | Tragic 10.6% |
| Nicaraguans | 0.4 /100 | #248 | Tragic 10.6% |
| Cubans | 0.4 /100 | #249 | Tragic 10.6% |
| Salvadorans | 0.3 /100 | #250 | Tragic 10.7% |
| Iroquois | 0.3 /100 | #251 | Tragic 10.7% |
| Immigrants | Zaire | 0.3 /100 | #252 | Tragic 10.7% |
| Immigrants | Western Africa | 0.3 /100 | #253 | Tragic 10.7% |
Demographics Similar to West Indians by Family Poverty
In terms of family poverty, the demographic groups most similar to West Indians are Immigrants from Barbados (11.5%, a difference of 0.010%), Immigrants from Belize (11.5%, a difference of 0.060%), Haitian (11.5%, a difference of 0.060%), Immigrants from Somalia (11.5%, a difference of 0.17%), and Vietnamese (11.5%, a difference of 0.25%).
| Demographics | Rating | Rank | Family Poverty |
| Indonesians | 0.0 /100 | #283 | Tragic 11.3% |
| Yaqui | 0.0 /100 | #284 | Tragic 11.3% |
| Barbadians | 0.0 /100 | #285 | Tragic 11.3% |
| Senegalese | 0.0 /100 | #286 | Tragic 11.5% |
| Vietnamese | 0.0 /100 | #287 | Tragic 11.5% |
| Immigrants | Belize | 0.0 /100 | #288 | Tragic 11.5% |
| Immigrants | Barbados | 0.0 /100 | #289 | Tragic 11.5% |
| West Indians | 0.0 /100 | #290 | Tragic 11.5% |
| Haitians | 0.0 /100 | #291 | Tragic 11.5% |
| Immigrants | Somalia | 0.0 /100 | #292 | Tragic 11.5% |
| Immigrants | Cabo Verde | 0.0 /100 | #293 | Tragic 11.6% |
| Immigrants | St. Vincent and the Grenadines | 0.0 /100 | #294 | Tragic 11.6% |
| Immigrants | Haiti | 0.0 /100 | #295 | Tragic 11.6% |
| Choctaw | 0.0 /100 | #296 | Tragic 11.6% |
| Creek | 0.0 /100 | #297 | Tragic 11.7% |