Immigrants from Russia vs Immigrants from Jordan Poverty
COMPARE
Immigrants from Russia
Immigrants from Jordan
Poverty
Poverty Comparison
Immigrants from Russia
Immigrants from Jordan
11.7%
POVERTY
89.7/ 100
METRIC RATING
116th/ 347
METRIC RANK
11.9%
POVERTY
82.4/ 100
METRIC RATING
138th/ 347
METRIC RANK
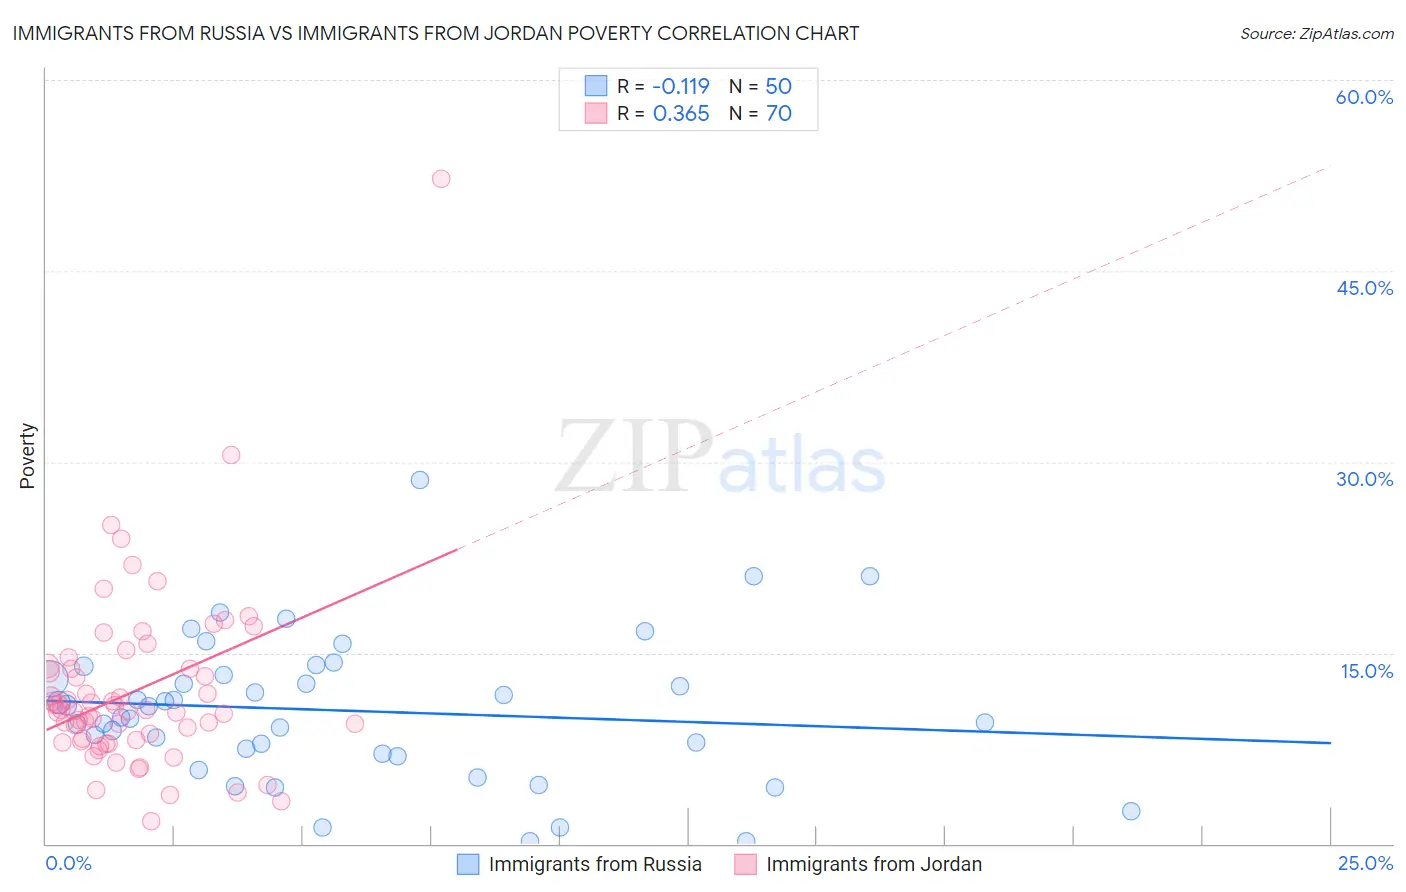
Immigrants from Russia vs Immigrants from Jordan Poverty Correlation Chart
The statistical analysis conducted on geographies consisting of 347,709,239 people shows a poor negative correlation between the proportion of Immigrants from Russia and poverty level in the United States with a correlation coefficient (R) of -0.119 and weighted average of 11.7%. Similarly, the statistical analysis conducted on geographies consisting of 181,257,123 people shows a mild positive correlation between the proportion of Immigrants from Jordan and poverty level in the United States with a correlation coefficient (R) of 0.365 and weighted average of 11.9%, a difference of 1.6%.
Poverty Correlation Summary
| Measurement | Immigrants from Russia | Immigrants from Jordan |
| Minimum | 0.17% | 1.8% |
| Maximum | 28.6% | 52.2% |
| Range | 28.4% | 50.4% |
| Mean | 10.4% | 12.0% |
| Median | 10.4% | 10.5% |
| Interquartile 25% (IQ1) | 7.1% | 8.1% |
| Interquartile 75% (IQ3) | 13.3% | 13.8% |
| Interquartile Range (IQR) | 6.2% | 5.6% |
| Standard Deviation (Sample) | 5.7% | 7.2% |
| Standard Deviation (Population) | 5.6% | 7.1% |
Similar Demographics by Poverty
Demographics Similar to Immigrants from Russia by Poverty
In terms of poverty, the demographic groups most similar to Immigrants from Russia are Sri Lankan (11.7%, a difference of 0.070%), Argentinean (11.7%, a difference of 0.15%), Albanian (11.7%, a difference of 0.17%), Tlingit-Haida (11.7%, a difference of 0.19%), and Immigrants from South Eastern Asia (11.7%, a difference of 0.20%).
| Demographics | Rating | Rank | Poverty |
| Immigrants | Turkey | 91.7 /100 | #109 | Exceptional 11.6% |
| Welsh | 91.6 /100 | #110 | Exceptional 11.6% |
| French Canadians | 91.0 /100 | #111 | Exceptional 11.6% |
| Immigrants | Southern Europe | 90.8 /100 | #112 | Exceptional 11.6% |
| Immigrants | Belarus | 90.8 /100 | #113 | Exceptional 11.6% |
| Immigrants | China | 90.7 /100 | #114 | Exceptional 11.6% |
| Albanians | 90.3 /100 | #115 | Exceptional 11.7% |
| Immigrants | Russia | 89.7 /100 | #116 | Excellent 11.7% |
| Sri Lankans | 89.4 /100 | #117 | Excellent 11.7% |
| Argentineans | 89.1 /100 | #118 | Excellent 11.7% |
| Tlingit-Haida | 89.0 /100 | #119 | Excellent 11.7% |
| Immigrants | South Eastern Asia | 88.9 /100 | #120 | Excellent 11.7% |
| New Zealanders | 88.7 /100 | #121 | Excellent 11.7% |
| Puget Sound Salish | 88.7 /100 | #122 | Excellent 11.7% |
| Immigrants | Hungary | 88.6 /100 | #123 | Excellent 11.7% |
Demographics Similar to Immigrants from Jordan by Poverty
In terms of poverty, the demographic groups most similar to Immigrants from Jordan are Pakistani (11.9%, a difference of 0.030%), Immigrants from Switzerland (11.8%, a difference of 0.11%), Immigrants from Peru (11.9%, a difference of 0.22%), Immigrants from France (11.9%, a difference of 0.31%), and Chilean (11.8%, a difference of 0.32%).
| Demographics | Rating | Rank | Poverty |
| French | 86.1 /100 | #131 | Excellent 11.8% |
| Peruvians | 85.6 /100 | #132 | Excellent 11.8% |
| Immigrants | Western Europe | 85.2 /100 | #133 | Excellent 11.8% |
| Yugoslavians | 85.2 /100 | #134 | Excellent 11.8% |
| Immigrants | Vietnam | 85.2 /100 | #135 | Excellent 11.8% |
| Chileans | 84.2 /100 | #136 | Excellent 11.8% |
| Immigrants | Switzerland | 83.0 /100 | #137 | Excellent 11.8% |
| Immigrants | Jordan | 82.4 /100 | #138 | Excellent 11.9% |
| Pakistanis | 82.2 /100 | #139 | Excellent 11.9% |
| Immigrants | Peru | 81.1 /100 | #140 | Excellent 11.9% |
| Immigrants | France | 80.5 /100 | #141 | Excellent 11.9% |
| Basques | 80.4 /100 | #142 | Excellent 11.9% |
| Brazilians | 79.7 /100 | #143 | Good 11.9% |
| Icelanders | 77.9 /100 | #144 | Good 11.9% |
| Syrians | 75.1 /100 | #145 | Good 12.0% |