Central American vs U.S. Virgin Islander Disability Age Over 75
COMPARE
Central American
U.S. Virgin Islander
Disability Age Over 75
Disability Age Over 75 Comparison
Central Americans
U.S. Virgin Islanders
48.8%
DISABILITY AGE OVER 75
0.4/ 100
METRIC RATING
259th/ 347
METRIC RANK
48.9%
DISABILITY AGE OVER 75
0.2/ 100
METRIC RATING
266th/ 347
METRIC RANK
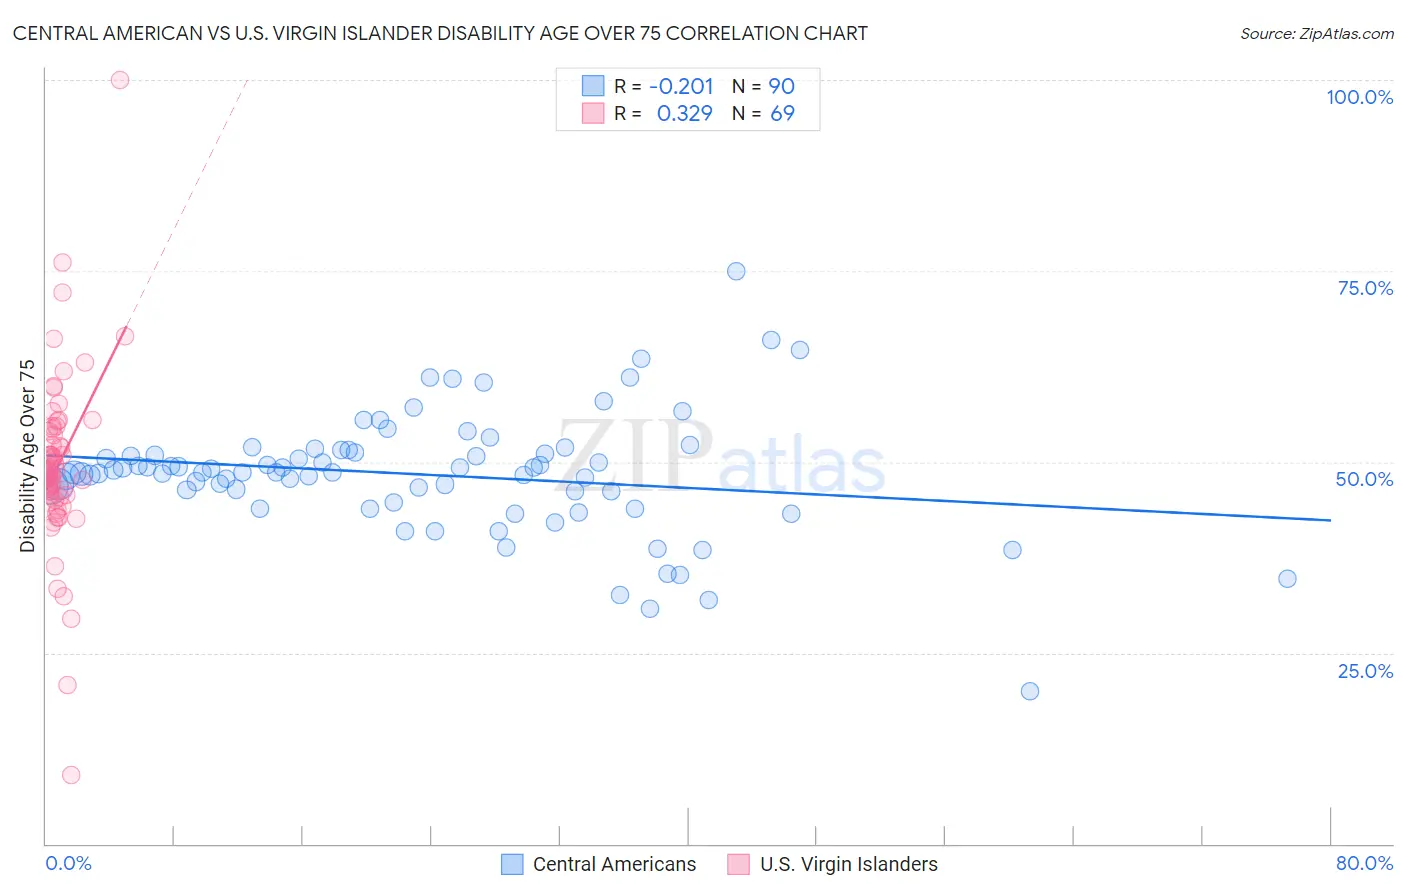
Central American vs U.S. Virgin Islander Disability Age Over 75 Correlation Chart
The statistical analysis conducted on geographies consisting of 503,152,130 people shows a weak negative correlation between the proportion of Central Americans and percentage of population with a disability over the age of 75 in the United States with a correlation coefficient (R) of -0.201 and weighted average of 48.8%. Similarly, the statistical analysis conducted on geographies consisting of 87,458,897 people shows a mild positive correlation between the proportion of U.S. Virgin Islanders and percentage of population with a disability over the age of 75 in the United States with a correlation coefficient (R) of 0.329 and weighted average of 48.9%, a difference of 0.26%.
Disability Age Over 75 Correlation Summary
| Measurement | Central American | U.S. Virgin Islander |
| Minimum | 20.0% | 9.0% |
| Maximum | 75.0% | 100.0% |
| Range | 55.0% | 91.0% |
| Mean | 48.4% | 49.6% |
| Median | 48.6% | 48.8% |
| Interquartile 25% (IQ1) | 46.1% | 45.5% |
| Interquartile 75% (IQ3) | 51.3% | 54.2% |
| Interquartile Range (IQR) | 5.1% | 8.7% |
| Standard Deviation (Sample) | 8.0% | 11.7% |
| Standard Deviation (Population) | 7.9% | 11.7% |
Demographics Similar to Central Americans and U.S. Virgin Islanders by Disability Age Over 75
In terms of disability age over 75, the demographic groups most similar to Central Americans are Immigrants from Afghanistan (48.8%, a difference of 0.040%), Immigrants from Philippines (48.8%, a difference of 0.070%), African (48.9%, a difference of 0.10%), Blackfeet (48.8%, a difference of 0.11%), and Immigrants from West Indies (48.9%, a difference of 0.16%). Similarly, the demographic groups most similar to U.S. Virgin Islanders are Honduran (48.9%, a difference of 0.030%), Immigrants from Honduras (48.9%, a difference of 0.040%), Salvadoran (48.9%, a difference of 0.090%), Immigrants from West Indies (48.9%, a difference of 0.11%), and Malaysian (49.0%, a difference of 0.13%).
| Demographics | Rating | Rank | Disability Age Over 75 |
| Immigrants | South Eastern Asia | 0.7 /100 | #252 | Tragic 48.7% |
| British West Indians | 0.6 /100 | #253 | Tragic 48.7% |
| Immigrants | Vietnam | 0.6 /100 | #254 | Tragic 48.7% |
| Chinese | 0.5 /100 | #255 | Tragic 48.7% |
| Immigrants | Congo | 0.5 /100 | #256 | Tragic 48.7% |
| Blackfeet | 0.5 /100 | #257 | Tragic 48.8% |
| Immigrants | Philippines | 0.4 /100 | #258 | Tragic 48.8% |
| Central Americans | 0.4 /100 | #259 | Tragic 48.8% |
| Immigrants | Afghanistan | 0.4 /100 | #260 | Tragic 48.8% |
| Africans | 0.3 /100 | #261 | Tragic 48.9% |
| Immigrants | West Indies | 0.3 /100 | #262 | Tragic 48.9% |
| Salvadorans | 0.3 /100 | #263 | Tragic 48.9% |
| Immigrants | Honduras | 0.3 /100 | #264 | Tragic 48.9% |
| Hondurans | 0.3 /100 | #265 | Tragic 48.9% |
| U.S. Virgin Islanders | 0.2 /100 | #266 | Tragic 48.9% |
| Malaysians | 0.2 /100 | #267 | Tragic 49.0% |
| Guatemalans | 0.2 /100 | #268 | Tragic 49.0% |
| Immigrants | El Salvador | 0.2 /100 | #269 | Tragic 49.0% |
| Potawatomi | 0.2 /100 | #270 | Tragic 49.0% |
| Fijians | 0.2 /100 | #271 | Tragic 49.0% |
| Assyrians/Chaldeans/Syriacs | 0.2 /100 | #272 | Tragic 49.1% |