Central American vs Immigrants from Canada Seniors Poverty Over the Age of 65
COMPARE
Central American
Immigrants from Canada
Seniors Poverty Over the Age of 65
Seniors Poverty Over the Age of 65 Comparison
Central Americans
Immigrants from Canada
13.4%
SENIORS POVERTY OVER THE AGE OF 65
0.0/ 100
METRIC RATING
283rd/ 347
METRIC RANK
9.8%
SENIORS POVERTY OVER THE AGE OF 65
99.0/ 100
METRIC RATING
59th/ 347
METRIC RANK
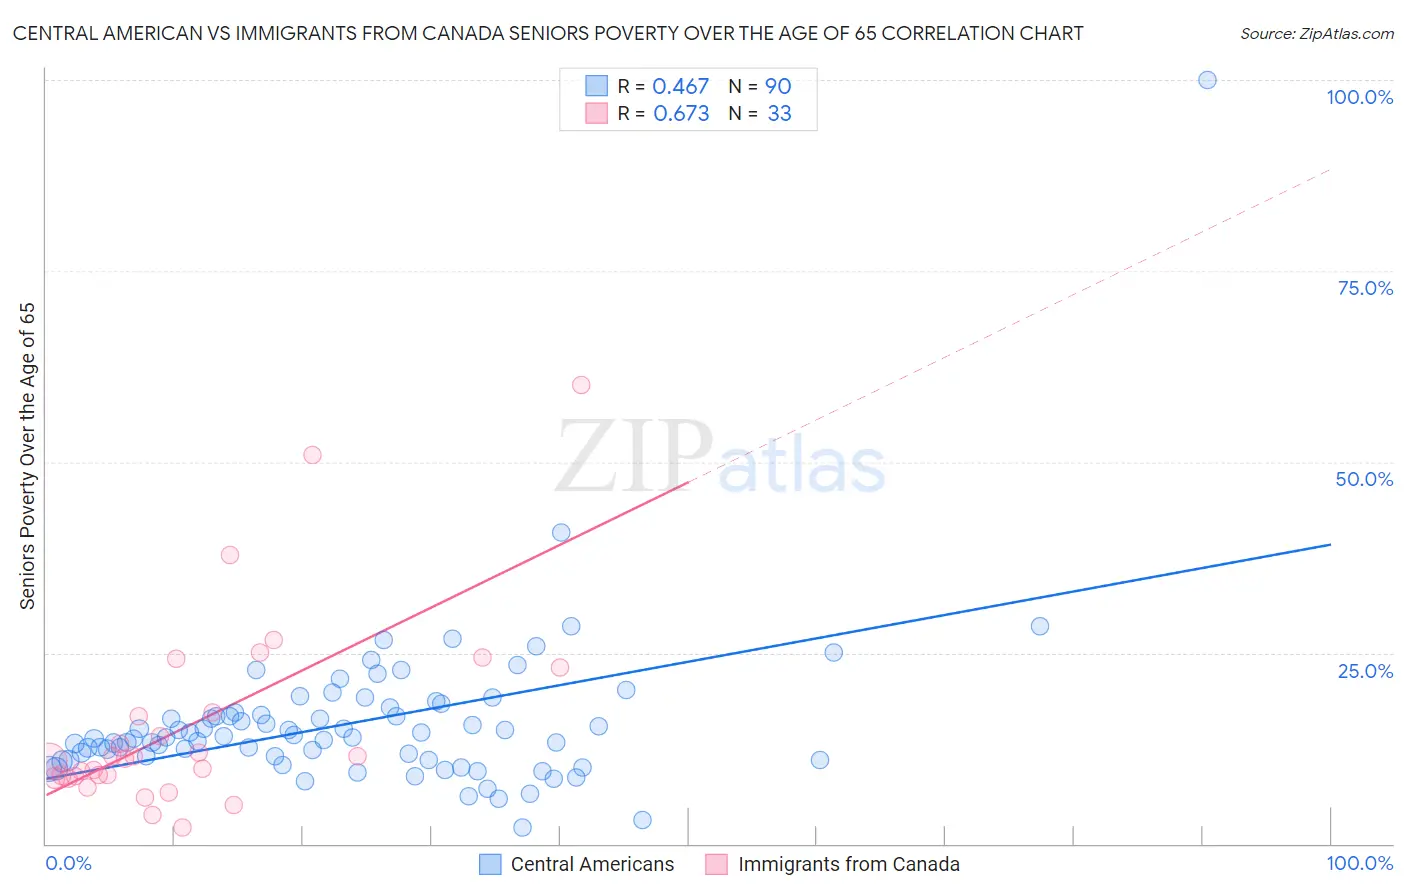
Central American vs Immigrants from Canada Seniors Poverty Over the Age of 65 Correlation Chart
The statistical analysis conducted on geographies consisting of 501,778,259 people shows a moderate positive correlation between the proportion of Central Americans and poverty level among seniors over the age of 65 in the United States with a correlation coefficient (R) of 0.467 and weighted average of 13.4%. Similarly, the statistical analysis conducted on geographies consisting of 457,331,043 people shows a significant positive correlation between the proportion of Immigrants from Canada and poverty level among seniors over the age of 65 in the United States with a correlation coefficient (R) of 0.673 and weighted average of 9.8%, a difference of 36.3%.
Seniors Poverty Over the Age of 65 Correlation Summary
| Measurement | Central American | Immigrants from Canada |
| Minimum | 2.1% | 2.1% |
| Maximum | 100.0% | 60.0% |
| Range | 97.9% | 57.9% |
| Mean | 15.8% | 15.6% |
| Median | 13.9% | 11.1% |
| Interquartile 25% (IQ1) | 11.0% | 8.7% |
| Interquartile 75% (IQ3) | 17.2% | 20.1% |
| Interquartile Range (IQR) | 6.3% | 11.4% |
| Standard Deviation (Sample) | 10.8% | 12.9% |
| Standard Deviation (Population) | 10.8% | 12.7% |
Similar Demographics by Seniors Poverty Over the Age of 65
Demographics Similar to Central Americans by Seniors Poverty Over the Age of 65
In terms of seniors poverty over the age of 65, the demographic groups most similar to Central Americans are Senegalese (13.3%, a difference of 0.82%), Colville (13.5%, a difference of 0.89%), Guatemalan (13.5%, a difference of 1.1%), Immigrants from Senegal (13.6%, a difference of 1.4%), and Immigrants from Mexico (13.6%, a difference of 1.5%).
| Demographics | Rating | Rank | Seniors Poverty Over the Age of 65 |
| Immigrants | Azores | 0.0 /100 | #276 | Tragic 12.9% |
| Paiute | 0.0 /100 | #277 | Tragic 12.9% |
| Immigrants | Bahamas | 0.0 /100 | #278 | Tragic 13.0% |
| Mexicans | 0.0 /100 | #279 | Tragic 13.1% |
| Yuman | 0.0 /100 | #280 | Tragic 13.1% |
| Immigrants | El Salvador | 0.0 /100 | #281 | Tragic 13.1% |
| Senegalese | 0.0 /100 | #282 | Tragic 13.3% |
| Central Americans | 0.0 /100 | #283 | Tragic 13.4% |
| Colville | 0.0 /100 | #284 | Tragic 13.5% |
| Guatemalans | 0.0 /100 | #285 | Tragic 13.5% |
| Immigrants | Senegal | 0.0 /100 | #286 | Tragic 13.6% |
| Immigrants | Mexico | 0.0 /100 | #287 | Tragic 13.6% |
| Belizeans | 0.0 /100 | #288 | Tragic 13.6% |
| Jamaicans | 0.0 /100 | #289 | Tragic 13.6% |
| Immigrants | Central America | 0.0 /100 | #290 | Tragic 13.6% |
Demographics Similar to Immigrants from Canada by Seniors Poverty Over the Age of 65
In terms of seniors poverty over the age of 65, the demographic groups most similar to Immigrants from Canada are Celtic (9.8%, a difference of 0.030%), Iranian (9.8%, a difference of 0.11%), Serbian (9.8%, a difference of 0.15%), French Canadian (9.8%, a difference of 0.16%), and Bolivian (9.8%, a difference of 0.21%).
| Demographics | Rating | Rank | Seniors Poverty Over the Age of 65 |
| Filipinos | 99.3 /100 | #52 | Exceptional 9.7% |
| Slavs | 99.2 /100 | #53 | Exceptional 9.8% |
| Immigrants | Northern Europe | 99.2 /100 | #54 | Exceptional 9.8% |
| Afghans | 99.2 /100 | #55 | Exceptional 9.8% |
| Immigrants | England | 99.1 /100 | #56 | Exceptional 9.8% |
| Bolivians | 99.1 /100 | #57 | Exceptional 9.8% |
| Serbians | 99.1 /100 | #58 | Exceptional 9.8% |
| Immigrants | Canada | 99.0 /100 | #59 | Exceptional 9.8% |
| Celtics | 99.0 /100 | #60 | Exceptional 9.8% |
| Iranians | 98.9 /100 | #61 | Exceptional 9.8% |
| French Canadians | 98.9 /100 | #62 | Exceptional 9.8% |
| Macedonians | 98.8 /100 | #63 | Exceptional 9.9% |
| Immigrants | North America | 98.8 /100 | #64 | Exceptional 9.9% |
| Pennsylvania Germans | 98.7 /100 | #65 | Exceptional 9.9% |
| Immigrants | Netherlands | 98.7 /100 | #66 | Exceptional 9.9% |