Central American Indian vs Dutch Single Male Poverty
COMPARE
Central American Indian
Dutch
Single Male Poverty
Single Male Poverty Comparison
Central American Indians
Dutch
17.2%
SINGLE MALE POVERTY
0.0/ 100
METRIC RATING
326th/ 347
METRIC RANK
14.1%
SINGLE MALE POVERTY
0.1/ 100
METRIC RATING
276th/ 347
METRIC RANK
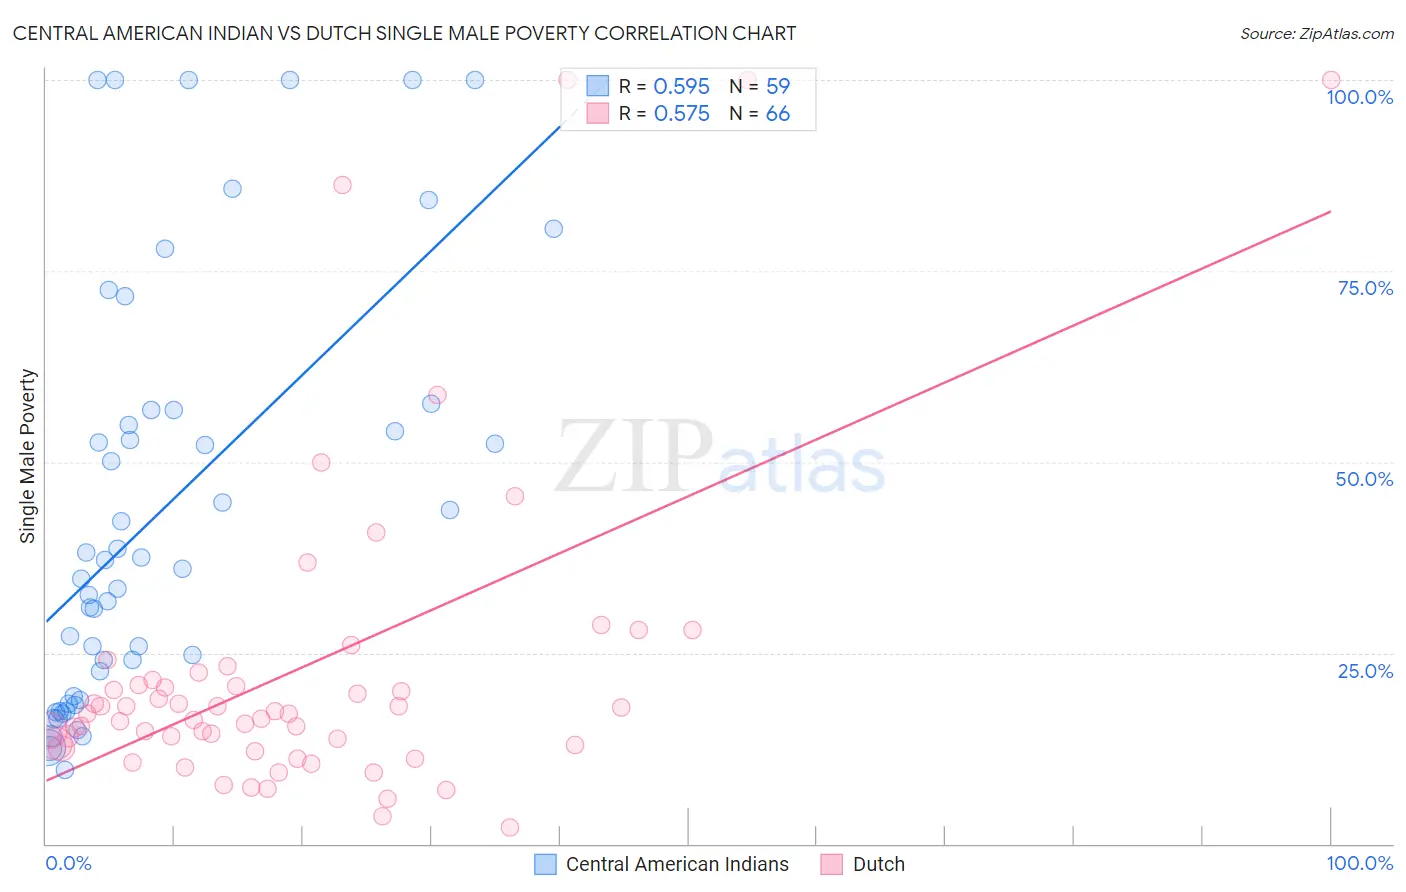
Central American Indian vs Dutch Single Male Poverty Correlation Chart
The statistical analysis conducted on geographies consisting of 299,936,739 people shows a substantial positive correlation between the proportion of Central American Indians and poverty level among single males in the United States with a correlation coefficient (R) of 0.595 and weighted average of 17.2%. Similarly, the statistical analysis conducted on geographies consisting of 460,167,982 people shows a substantial positive correlation between the proportion of Dutch and poverty level among single males in the United States with a correlation coefficient (R) of 0.575 and weighted average of 14.1%, a difference of 22.5%.
Single Male Poverty Correlation Summary
| Measurement | Central American Indian | Dutch |
| Minimum | 9.7% | 2.1% |
| Maximum | 100.0% | 100.0% |
| Range | 90.3% | 97.9% |
| Mean | 43.3% | 22.9% |
| Median | 36.0% | 17.0% |
| Interquartile 25% (IQ1) | 18.8% | 12.8% |
| Interquartile 75% (IQ3) | 56.8% | 21.5% |
| Interquartile Range (IQR) | 38.0% | 8.6% |
| Standard Deviation (Sample) | 27.4% | 21.4% |
| Standard Deviation (Population) | 27.2% | 21.2% |
Similar Demographics by Single Male Poverty
Demographics Similar to Central American Indians by Single Male Poverty
In terms of single male poverty, the demographic groups most similar to Central American Indians are Choctaw (17.0%, a difference of 1.6%), Immigrants from Yemen (16.9%, a difference of 2.3%), Creek (16.8%, a difference of 2.4%), Menominee (17.7%, a difference of 2.7%), and Shoshone (16.7%, a difference of 3.5%).
| Demographics | Rating | Rank | Single Male Poverty |
| Chippewa | 0.0 /100 | #319 | Tragic 16.4% |
| Marshallese | 0.0 /100 | #320 | Tragic 16.4% |
| Osage | 0.0 /100 | #321 | Tragic 16.5% |
| Shoshone | 0.0 /100 | #322 | Tragic 16.7% |
| Creek | 0.0 /100 | #323 | Tragic 16.8% |
| Immigrants | Yemen | 0.0 /100 | #324 | Tragic 16.9% |
| Choctaw | 0.0 /100 | #325 | Tragic 17.0% |
| Central American Indians | 0.0 /100 | #326 | Tragic 17.2% |
| Menominee | 0.0 /100 | #327 | Tragic 17.7% |
| Kiowa | 0.0 /100 | #328 | Tragic 18.3% |
| Colville | 0.0 /100 | #329 | Tragic 18.4% |
| Cajuns | 0.0 /100 | #330 | Tragic 19.1% |
| Paiute | 0.0 /100 | #331 | Tragic 19.3% |
| Natives/Alaskans | 0.0 /100 | #332 | Tragic 19.6% |
| Inupiat | 0.0 /100 | #333 | Tragic 20.0% |
Demographics Similar to Dutch by Single Male Poverty
In terms of single male poverty, the demographic groups most similar to Dutch are Immigrants from Honduras (14.1%, a difference of 0.040%), Slovak (14.1%, a difference of 0.10%), English (14.1%, a difference of 0.12%), Indonesian (14.1%, a difference of 0.14%), and Honduran (14.0%, a difference of 0.19%).
| Demographics | Rating | Rank | Single Male Poverty |
| Scottish | 0.1 /100 | #269 | Tragic 14.0% |
| Immigrants | Saudi Arabia | 0.1 /100 | #270 | Tragic 14.0% |
| Irish | 0.1 /100 | #271 | Tragic 14.0% |
| Mexicans | 0.1 /100 | #272 | Tragic 14.0% |
| Welsh | 0.1 /100 | #273 | Tragic 14.0% |
| Hondurans | 0.1 /100 | #274 | Tragic 14.0% |
| English | 0.1 /100 | #275 | Tragic 14.1% |
| Dutch | 0.1 /100 | #276 | Tragic 14.1% |
| Immigrants | Honduras | 0.0 /100 | #277 | Tragic 14.1% |
| Slovaks | 0.0 /100 | #278 | Tragic 14.1% |
| Indonesians | 0.0 /100 | #279 | Tragic 14.1% |
| Hmong | 0.0 /100 | #280 | Tragic 14.2% |
| Hispanics or Latinos | 0.0 /100 | #281 | Tragic 14.2% |
| Spanish Americans | 0.0 /100 | #282 | Tragic 14.2% |
| Yaqui | 0.0 /100 | #283 | Tragic 14.2% |